This site uses cookies to improve your experience. To help us insure we adhere to various privacy regulations, please select your country/region of residence. If you do not select a country, we will assume you are from the United States. Select your Cookie Settings or view our Privacy Policy and Terms of Use.
Cookie Settings
Cookies and similar technologies are used on this website for proper function of the website, for tracking performance analytics and for marketing purposes. We and some of our third-party providers may use cookie data for various purposes. Please review the cookie settings below and choose your preference.
Used for the proper function of the website
Used for monitoring website traffic and interactions
Cookie Settings
Cookies and similar technologies are used on this website for proper function of the website, for tracking performance analytics and for marketing purposes. We and some of our third-party providers may use cookie data for various purposes. Please review the cookie settings below and choose your preference.
Strictly Necessary: Used for the proper function of the website
Performance/Analytics: Used for monitoring website traffic and interactions
Onboarding gamification is the key to transforming a dull process into an engaging one. When the process feels complicated, it becomes easy for a new user to lose interest before they experience the true value of your product. What is onboarding gamification? Launching a new product. Why use a gamified onboarding process?
So, how do you get started with product analytics ? In this article, we’ll talk about: What product analytics is and why you need a solid strategy. Key steps to build and improve your product analytics strategy. How to apply actionable metrics to different SaaS business stages. What is product analytics?
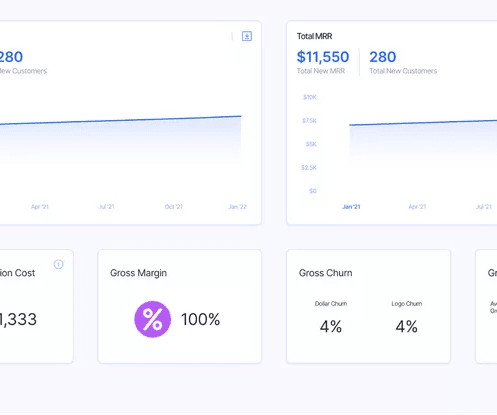
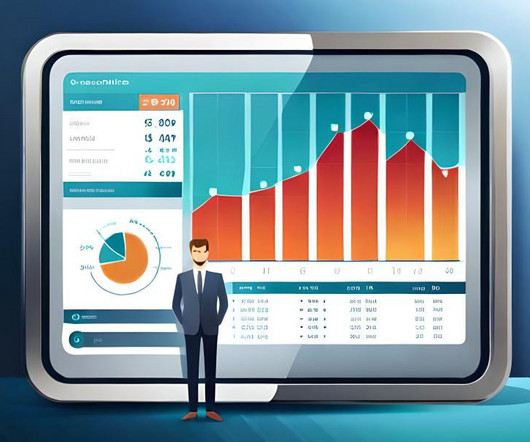
With an abundance of product analytics to track, having a robust SaaS KPI dashboard is essential to monitor the metrics that matter most. TL;DR A SaaS dashboard can be used to track important metrics and key performance indicators. What is a SaaS KPI dashboard? Let’s get into it! Usage monitoring.
When your company adopts multiple SaaS solutions to drive productivity, you unknowingly create a perfect storm for data fragmentation. Your customer information lives in Salesforce, while your support tickets are in Zendesk, your product usage data in Mixpanel, and your marketing campaigns in HubSpot. Which features need attention?
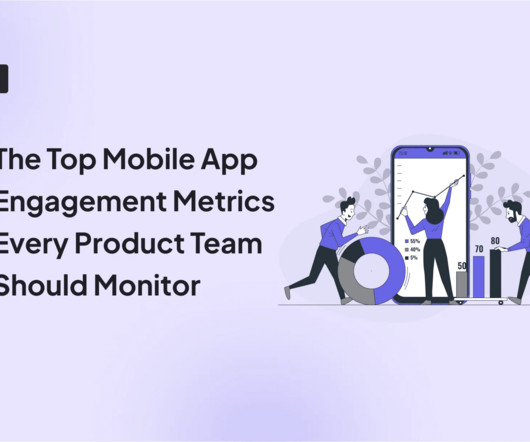
This is where these 10 key mobile app engagement metrics come in, helping track user behavior and preferences to answer all these questions and boost user activation. What are app engagement metrics? App engagement metrics provide quantitative insights into user interactions with your app. What is app engagement?
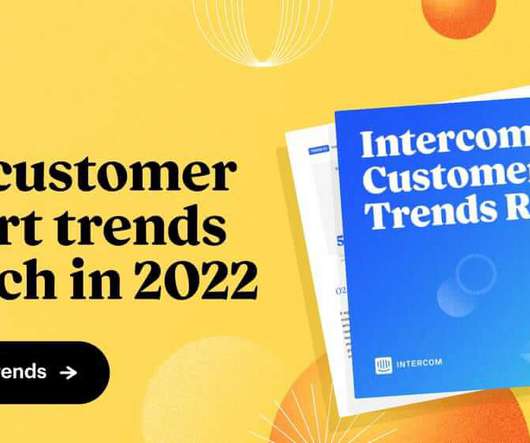
To keep up with these changes, last year we released our first Intercom Customer Support Trends Report. We have just published the second edition of the Intercom Customer Support Trends Report. You can download the full report at intercom.com, but for now, I’ll give you an overview of our customer support trends research.
In product design, measuring success is essential to ensure that design decisions lead to meaningful improvements and align with business outcomes. OKRs (Objectives and Key Results) and KPIs (Key Performance Indicators) are two common approaches, each serving a different purpose. What do these metrics mean?
Think of Net Promoter Score (NPS) software as a tool to measure your customers’ feelings about your product, and categorize them based on their level of loyalty (promoters, neutrals, and detractors). 1 Userpilot for product teams to collect and act on NPS data Creating NPS surveys with Userpilot.
At Userpilot, NPS is an integral part of our product. This is mainly because NPS was sold as a quantitative metric that is the ultimate indicator of growthespecially in product management. This metric ended up being adopted by companies in every industry. But lets be honest, NPS sucks at times. The sad truth is: its not.
Poor performance includes slow loading times, complex design, confusing navigation, and unresponsive features. This article will help reduce such churn by refining your product management and UX analysis approach. UX analytics involves gathering, analyzing, and interpreting data about how users interact with your product or service.
Collect customer data to calculate complex formulas for tracking metrics, monitor customer health scores, and resolve support tickets while continuously trying to improve retention and expansion. Consider specific features : Your goals and improvement areas will determine the features you need.
What will be the biggest ProductTrends in 2022? Interestingly – they seem completely different from the producttrends we’ve identified for 2021 – including Product Led Growth , the rise of a Growth Product Management Role, chatbots, or gamification. Will 2022 be the year of Product Ops?
You see, although we work hard to make Userpilot the best product adoption tool on the market, we know it isnt the perfect fit for every business. Helping prospects find the right product is a win-win situation. Userpilots key features include: No-code Chrome extension for building in-app flows. Pendo The dashboard on Pendo.
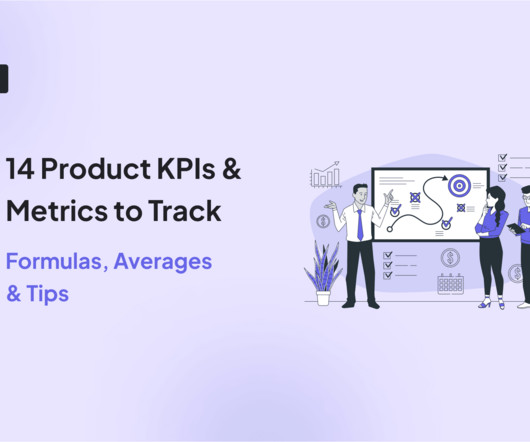
And we think it applies just as well to productKPIs. ” Here are 14 essential product management KPIs you need to measure (tips for improving them + industry averages included!). TL;DR Product management KPIs are measurable values used to evaluate how well a product achieves its goals.
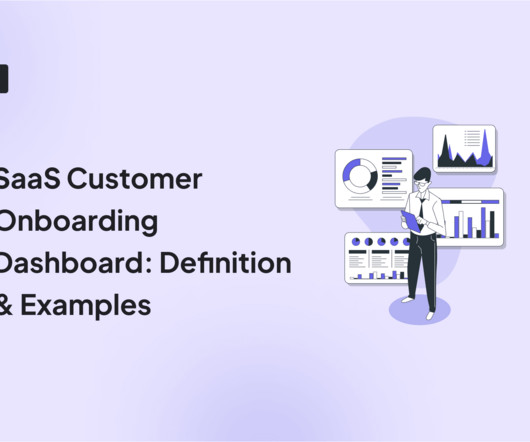
In SaaS, a customer onboarding dashboard can become a massive product analytics tool to understand and optimize the user journey. But what type of dashboards can you use to analyze your onboarding process? Let’s explore how a customer onboarding dashboard works and see different examples.
Product marketing metrics are key for understanding and optimizing the performance of your product. They help you measure success, identify areas for improvement, and align your product management strategies with your overall business goals. Time-to-value : Tracks how quickly users realize the value of the product.
Userpilot’s SaaS ProductMetrics Benchmark Report has found that compared to other industries, healthcare SaaS companies perform lower across most of the 6 metrics we studied. You will also learn how healthcare companies can improve their productmetrics. Onboarding checklist completion rate. Time to Value.
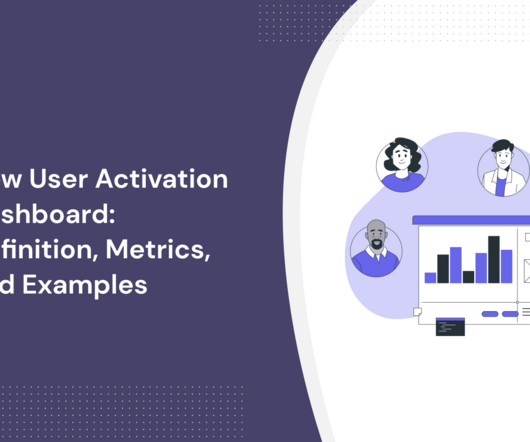
In SaaS, a new user activation dashboard can become a massive product analytics tool to understand and optimize the user journey. Let’s explore how a new user activation dashboard works, look at the key metrics you need to include in it, and see how it can help you unlock ways to retain more customers. What is user activation?
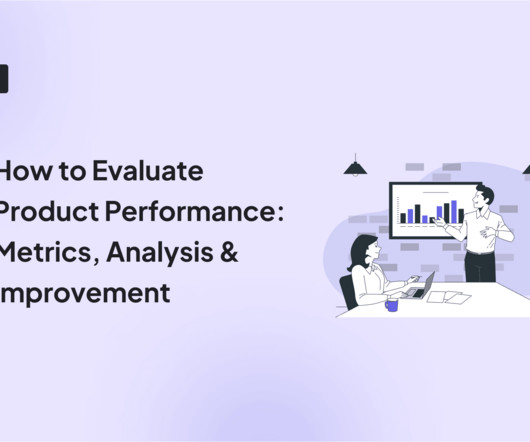
It’s no secret that learning how to evaluate product performance is essential for product management. But how can you effectively measure productmetrics that can help you reach your goals and increase revenue growth? Why not book a Userpilot demo to see how you can analyze and improve product performance continuously?
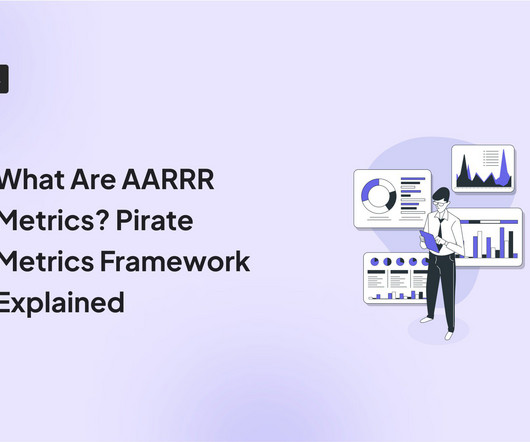
” And that’s also why AARRR metrics are called pirate metrics. Short for acquisition, activation, retention, referral, and revenue, these metrics help you measure and drive product growth. In this article, we’ll dig deeper into the AARRR framework and the relevant metrics associated with each stage.
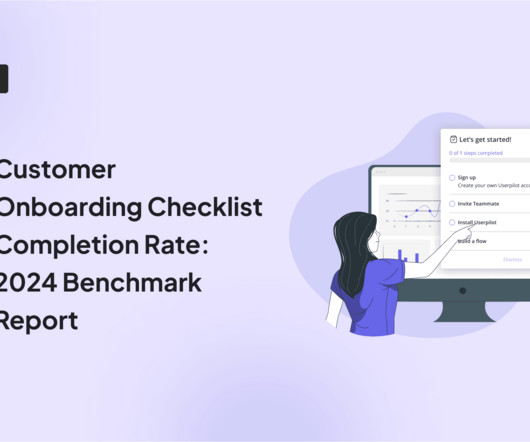
Which SaaS industry has the highest customer onboarding checklist completion rate? Product-led ones than sales-led ones? These are the key questions we explore in the article based on our recent ProductMetrics Benchmark Report 2024 which investigates company performance in 6 different metrics across 7+ industries.
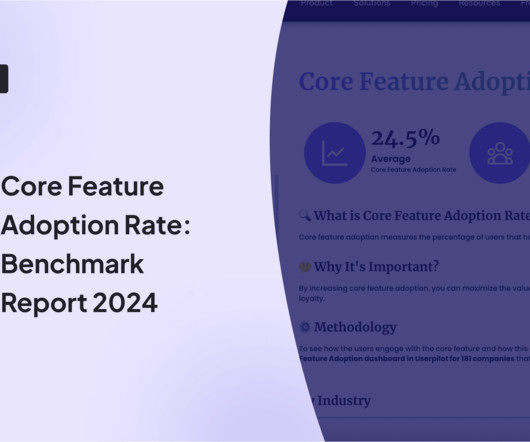
That’s the average core feature activation rate across the companies we studied for our ProductMetrics Benchmark Report 2024. We also look at ways to improve the core feature activation rate for your SaaS product! We also look at ways to improve the core feature activation rate for your SaaS product!
A customer expansion strategy is a playbook for increasing the revenue from your existing customers, for example, by selling them additional products and services or encouraging them to upgrade to higher plans. This metric helps SaaS companies track the effectiveness of their expansion efforts. What metrics should you consider?
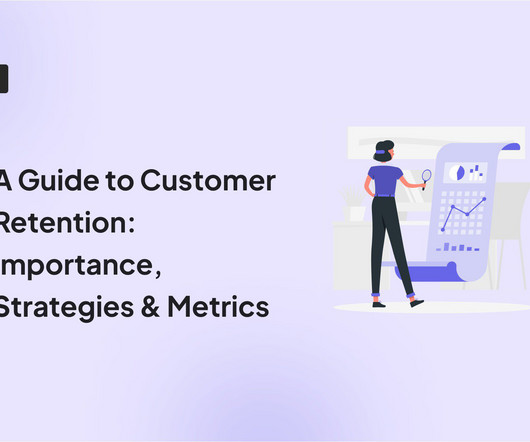
Customer retention is vital for product success and business profitability. You will also learn how to build a retention strategy, what metrics to track, and 10 bulletproof retention tactics for SaaS companies. TL;DR Customer retention is the ability to keep your customers actively using their products.
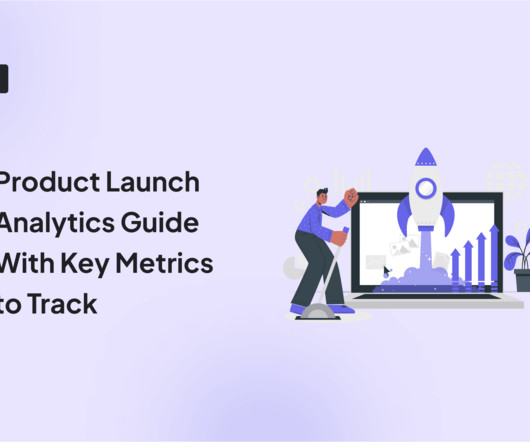
Whether you’re introducing a new product, releasing an upgrade, or announcing advanced features, outlining a product launch strategy can help align your efforts in the right direction. That’s where product launch analytics step into the picture. The key is to monitor all the data and optimize your strategy at each step.
By combining contextual insights from session replays , heatmaps, and behavior analytics, user session analysis helps you interpret metrics through the lens of real user journeys. Imagine a product team celebrating a 200% spike in sign-ups after a promotional campaign. On the surface, it looks like a win.
Would you like to learn how to design a SaaS metrics dashboard for your team without any coding? We also explain what metrics you may want to track and how to use the insights they offer. The Core Feature Engagement dashboard focuses on tracking usage and adoption trends for a pivotal productfeature to drive engagement strategies.
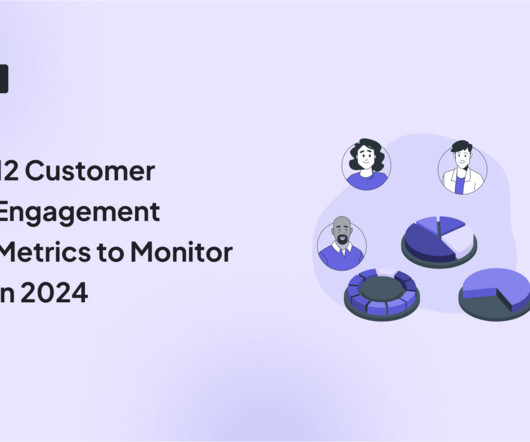
Wondering which customer engagement metrics to track? In this article, we discuss 12 key metrics you should cover – and why. We also look at the benefits of tracking user engagement for SaaS product teams! Time to Value (TTV) measures the duration it takes for customers to experience the product’s value.
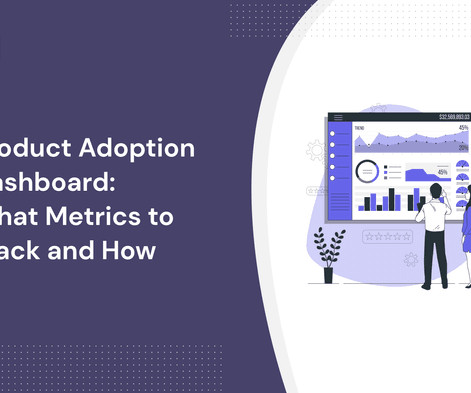
A product adoption dashboard helps you visualize key adoption metrics so you can make data-driven decisions and boost user engagement. In this article, we cover the following: Why you need a product adoption dashboard. The most important metrics to track and why they matter. Track product adoption metrics in one view.
Leveraging product analytics isnt just about making pretty dashboards; its about viewing your existing data as a learning opportunity to make informed decisions with your onboarding strategy. Start with your core business goals and map out 3-5 key metrics that directly support these objectives. How to solve this issue?
Maximizing Product Success Through Effective Metric Utilization As a product manager, understanding how your product is performing is crucial for making data-driven decisions that drive success. Let’s say you are a product manager for a social media platform that allows users to share photos and videos.
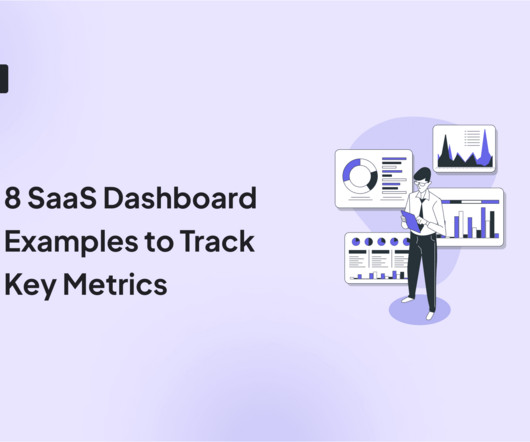
When it comes to product management, you need to look at different SaaS dashboard examples to see what kind of product analytics you can measure, and how. New user activation dashboard focuses on converting new sign-ups to active users by monitoring and analyzing activation metrics and trends.
With the right approach and proactive support tools – think Outbound Messages , Product Tours , and Mobile Carousels – you can provide every customer with the fast, personal help they need at the exact moment they need it. At Intercom, our Support Ops and Product Education teams work hand-in-hand to deliver proactive support to our customers.
That’s certainly the case for Kelsey Terry , who’s sharing her story in today’s Product in Practice. In her former role as Director of Product at Going (formerly known as Scott’s Cheap Flights), Kelsey was tasked with running a pilot product trio. Do you have a Product in Practice story you’d like to share?
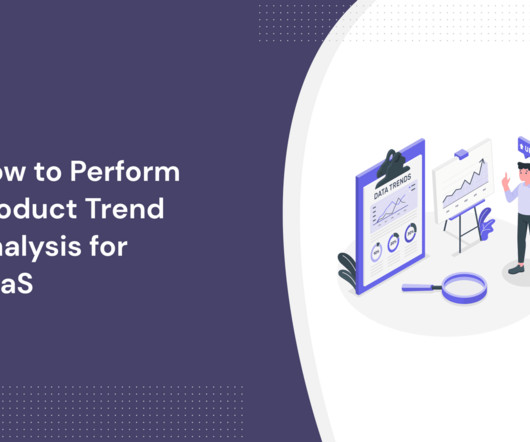
Performing trend and product analytics can help you make data-backed informed decisions to stay ahead of the competition. With trend analysis, you’ll be able to better understand both internal and external factors affecting your business operations.
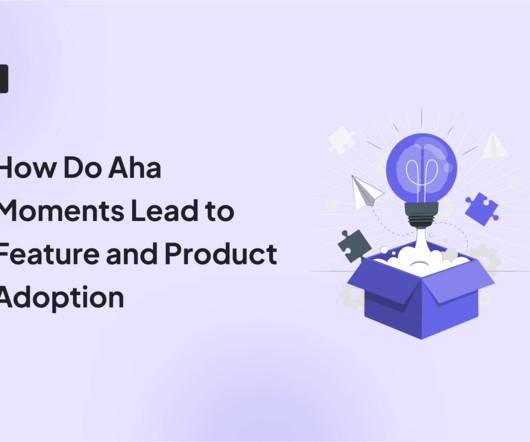
Wondering how Aha moments lead to feature and product adoption? The articles explains what the Aha moment is and what role it plays in user activation, product adoption , and customer retention. You will also learn how to find the Aha moment for your product and optimize it for different users. Ready to dive in?
What happens when you build a product or service around what you think potential customers want, only for them to buy something else? But worse than that, it leads to lower revenue, failed products, and plummeting customer loyalty. Does customer research help build better products? The short answer: yes.
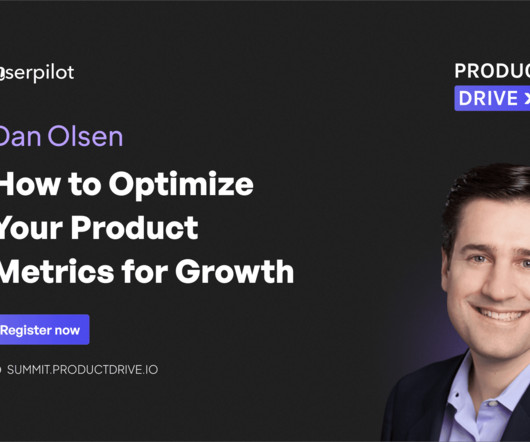
‘How to optimize your productmetrics for growth’ by Dan Olsen is one of the talks in this year’s Product Drive hosted by Userpilot. In this article, you will learn who Dan Olsen is, discover the core ideas from his book The Lean Product Playbook, and find out what you can expect from his talk.
It offers 8 products that help companies recruit staff, manage payroll and benefits, improve communications, and build workplace communities. The company realized their current onboarding solutions weren’t adequate, so they decided to give Userpilot a go. The product is expensive. Want to learn more? Book a demo!
According to Userpilot’s SaaS Product Success Metrics Benchmark report , Fintech and Insurance companies had the second-lowest activation and adoption rates of all industries. This is because the client onboarding process in financial services faces unique challenges. What are they? Let’s get started.
Tracking product analytics , such as feature usage, is useful for understanding feature adoption and user engagement. TL;DR The feature usage rate is an engagement metric that measures the number of users who have adopted a specific or new feature within your product.
It’s crucial to stay updated with the latest trends in customer analytics to better understand customers and make the most out of collected data! So, let’s see 8 critical trends you can follow to stay on track with the changes and how you can apply them to achieve product growth. Why should you analyze customer data?
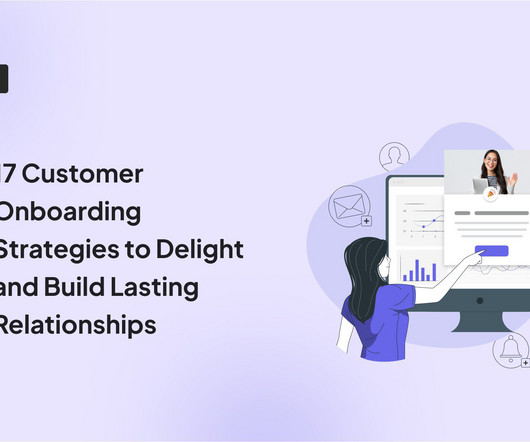
Researching customer onboarding strategies for your SaaS product? The article shares 17 tried-and-tested customer onboarding tactics that will help you build delightful user experiences and drive product growth. Create a welcome series of in-app and email messages to greet users and kick off onboarding.
The different reports can offer a variety of insights that help manage your product in the right direction. You just need to ensure you can get started correctly and the metrics you should report on to get the critical metrics. TL;DR SaaS reporting helps to track key metrics and inform the right decisions backed up with data.
We organize all of the trending information in your field so you don't have to. Join 96,000+ users and stay up to date on the latest articles your peers are reading.
You know about us, now we want to get to know you!
Let's personalize your content
Let's get even more personalized
We recognize your account from another site in our network, please click 'Send Email' below to continue with verifying your account and setting a password.


Let's personalize your content