This site uses cookies to improve your experience. To help us insure we adhere to various privacy regulations, please select your country/region of residence. If you do not select a country, we will assume you are from the United States. Select your Cookie Settings or view our Privacy Policy and Terms of Use.
Cookie Settings
Cookies and similar technologies are used on this website for proper function of the website, for tracking performance analytics and for marketing purposes. We and some of our third-party providers may use cookie data for various purposes. Please review the cookie settings below and choose your preference.
Used for the proper function of the website
Used for monitoring website traffic and interactions
Cookie Settings
Cookies and similar technologies are used on this website for proper function of the website, for tracking performance analytics and for marketing purposes. We and some of our third-party providers may use cookie data for various purposes. Please review the cookie settings below and choose your preference.
Strictly Necessary: Used for the proper function of the website
Performance/Analytics: Used for monitoring website traffic and interactions
Known as the Martech 5000 — nicknamed after the 5,000 companies that were competing in the global marketing technology space in 2017, it’s said to be the most frequently shared slide of all time. The reasons for this growth – high-velocity economics of software innovation, the migration of money from old media to new media, etc.
Data visualization tools help turn your messy spreadsheets into clear, interactive insights. So where do you find the right tools? In this guide, well break down the top data visualization tools for product teams, so you can stop guessing and start making smarter, data-driven decisions. What are data visualization tools?
As you’re researching dashboard reportingtools, you’ve probably noticed how hard it is to find reliable information on the available solutions. When choosing a dashboard tool, pay attention to the ease of use , customization, integrations , value, and data privacy to meet business needs effectively.
With companies relying entirely on data, it’s common sense to carry out SaaS reporting. The different reports can offer a variety of insights that help manage your product in the right direction. You just need to ensure you can get started correctly and the metrics you should report on to get the critical metrics.
Experts predict the Customer Analytics market will top $24 billion by 2025. Organizations need customer data to provide the empathetic, personalized experiences customer demand—and to stay competitive. Organizations need customer data to provide the empathetic, personalized experiences customer demand—and to stay competitive.
In this, we’ll explore more benefits of self-serve product analytics and also introduce you to the tools that help you implement this system in your company. TL;DR Self-service analytics is a business intelligence (BI) approach that empowers users to access, analyze, and interpret data without relying on IT or data teams.
It empowers each team across the organization to make data-driven decisions, with access to reporting and ad hoc analysis. . What Technology Do You Need in Your Stack? As technology develops, analytics stacks become easier to set up, manage, and scale. The data and analytics space is rapidly growing, expanding, and evolving.
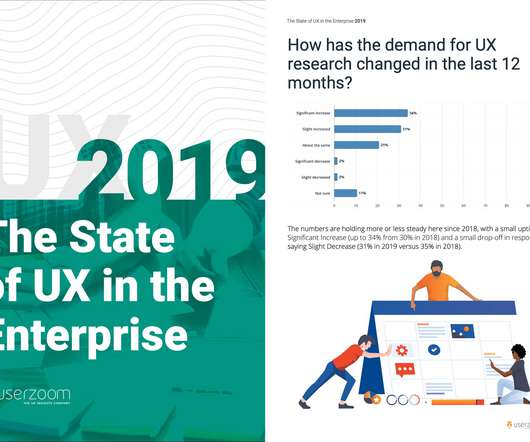
If you’re in the process of democratizing UX beyond the boundaries of your own UX team, and equipping other people in the organization with the skills to run their own research, s tandardization can increase efficiency and helps set expectations of what’s involved in a userresearch project. UX Researcher | GrubHub. “It
Here’s a breakdown of the typical career progression: Junior BI Analyst/Data Analyst (0-3 Years) BI Analyst (3-5 Years) Senior BI Analyst/Lead BI Analyst (5-10+ Years) BI Manager/Director (10+ Years) The path to becoming a business intelligence (BI) analyst is not a one-size-fits-all journey. Book a demo to see it in action!
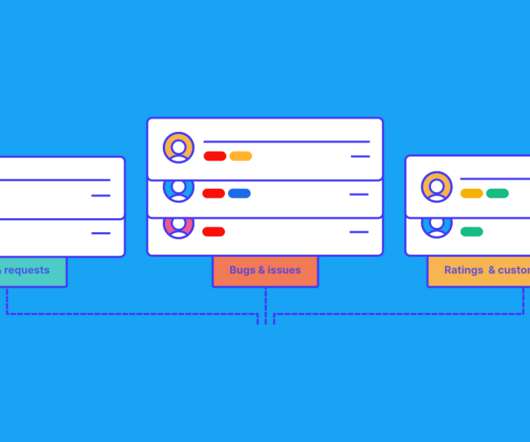
Product operations plays a key role here, conducting user issue analyses and building processes to prevent bad experiences. Key Tasks User issues reports. Identify, investigate, prioritize, and publish analyses on user issues to speed issue resolution. Bug Service Level Agreement (SLA). Product health tracking.
So, we rely on software, spreadsheets, and statistical packages to make our best judgment calls. In this article, you’ll learn about a new genre of customer analytics capabilities that speak the language of people, rather than systems. If you use Looker, for instance, you probably rely on this platform’s data capabilities.
Tracking cross-platform analytics is essential for product teams to see a complete view of customer behavior. TL;DR Cross-platform analytics is the activity of tracking and analyzing user behavior across multiple platforms or devices. What is cross-platform analytics?
Choosing the right embedded analytics platform for your business needs is paramount. With its robust capabilities to expand your business, add value to your customers, and ultimately grow your profits, embedded analytics solutions are becoming essential for businesses that want to be able to survive in the market.
Are you looking for Zendesk integrations to boost the efficiency of your self-servicecustomer support? The article explores the best Zendesk integrations for: Customer support Customerfeedback Productivity Email and social media communication Analytics and reporting Let's get right to it!
This is where tools such as Reveal and Looker come in handy – they convert raw data into easy-to-understand and easy-to-use insights that enable organizations to reshape and modernize the way they do business. What is Looker? What Is Looker? Reveal VS Looker – Comparing Features & Functionalities.
Ever found yourself getting loads of feedback, but didn’t have the customerfeedbacksystem in place to do something with it all? Not only is it a mess for you, but it can also let your customers down when you don’t do something about their feedback. The customerfeedbacksystem learning.
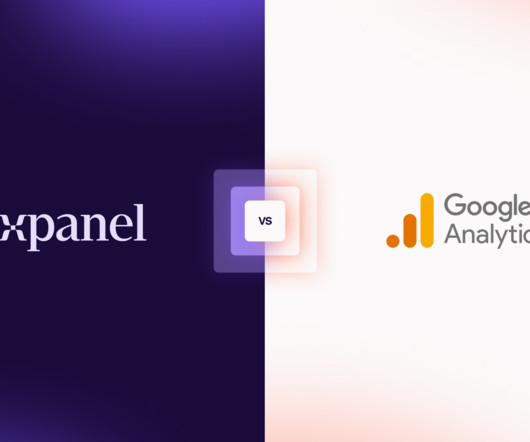
From understanding the analytics landscape to mapping capabilities with KPIs and integrating new tools with your current stack, we know that choosing a product analytics solution can be overwhelming—not to mention, time-consuming. How is Mixpanel different from marketing analytics tools like Google Analytics?
Embarking on a career as a customer insights manager involves a combination of education, skills development, and practical experience. This guide will provide you with a comprehensive overview of the path to becoming a successful customer insights manager. Let’s dive in!
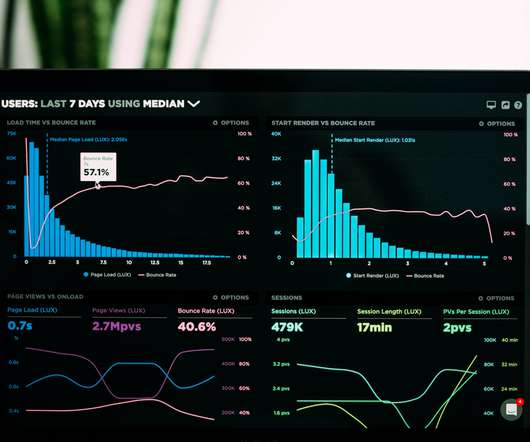
Master Google Analytics 4 for user behavior analysis, UX design optimization, and enhanced website performance to improve sales. Let’s start, Google Analytics 4 is a powerful web analytics service that provides valuable insights into user behavior, engagement, website conversion, and much more. It’s six years old.
Testing in production is becoming more and more common across tech. The most significant benefit is knowing that your features work in production before your users have access. The following plan is both guidance and order of operations for what to implement if you want to start testing in production. The First 30 Days.
Our data scientists and analysts—with over 40 years of combined experience at companies including Zoom, Meta, Reddit, Twitter, and Google—require powerful and sophisticated tooling for business operation and revenue data analysis. Up until now, that was handled by Mixpanel and Looker, our BI (business intelligence) solution of choice.
Have you ever made a costly mistake because your customerfeedback analysis wasn’t on point? That gold mine list of feedback turned into a mine field? If the same has happened to you, then you’re probably asking yourself: how should I most effectively use the customerfeedback that comes in to make better business decisions?
Here’s a breakdown of the typical career progression: Junior BI Analyst/Data Analyst (0-3 Years) BI Analyst (3-5 Years) Senior BI Analyst/Lead BI Analyst (5-10+ Years) BI Manager/Director (10+ Years) The path to becoming a business intelligence (BI) analyst is not a one-size-fits-all journey. Book a demo to see it in action!
To quickly summarize, we collect marketing, sales, and product data from the relevant systems of record, merge them together in BigQuery using Salesforce account IDs as a common identifier and tag each account with whether it belongs to our ideal customer profile (ICP). Data structure for our Mixpanel project.
Time and again, folks have used product analytics tools to better understand their customers. Businesses use analytics to determine product health, improve the customer experience, test product-market fit, and ensure that they are making the right investments with limited time and resources.
TL;DR A product analyst is a professional who conducts product research , analyzes, and interprets such data to make accurate decisions about the product. Lead Product Analyst : A lead product manager leads the product analysis efforts and monitors the research, analysis, reporting , and strategy development. Product Analyst.
Among all embedded analytics products on the market, Tableau is certainly one of the most popular BI tools for analyzing, visualizing, and working with data. But like any other softwaresolution on the market, Tableau is also not perfect and surely not the best fit for every business use case.
Whether you’re looking to deepen your expertise, stay updated with industry trends, or find practical tools to enhance your workflow, the right resources are essential for continuous growth and success. Looking to leverage product data for insights? Consider Userpilot for its engagement features and analytics capabilities.
Today, about one-third of Americans have used a dating app or site, and 12% have either been in a committed relationship or gotten married to someone they met through online dating, according to a recent Pew Researchreport. I’ve been with OkCupid for three years and I manage our data science team, which handles platform analytics.
For marketing teams focused on getting more user traffic and signups, Google Analytics has been the tool of choice. But with customers spending more time researching and buying online, websites and product experiences are converging to accommodate customer needs, and the scope of analysis for most marketers is increasing.
This entire episode is brought to you by Jira Product Discovery —Atlassian’s new prioritization and roadmapping tool built for product teams — Melissa Perri is the CEO of Produx Labs, a product management training organization; author of the seminal PM book The Build Trap ; and a former Harvard Business School professor of product (..)
Where does product analytics fit in the realm of analytics tools on the market? Hint: Skip to 3:45 to learn how Amplitude compares to BI tools and marketing analytics.). The way customers feel about the product is your new brand. Kind of improvements that we are making to the cold platform over the last 12 months or so.
The iOS, Android and web development teams are responsible for instrumenting (and ideally testing) those events in the code and will have an opinion on what’s feasible. Looker and Mixpanel). Software Engineer. In short, in a data-led company analytics involves almost everyone. If it’s owned by everybody, it’s owned by nobody.
Where does product analytics fit in the realm of analytics tools on the market? Hint: Skip to 3:45 to learn how Amplitude compares to BI tools and marketing analytics.). How Amplitude differs from BI tools and marketing analytics (and other questions) Click To Tweet. You can find a full transcript below.
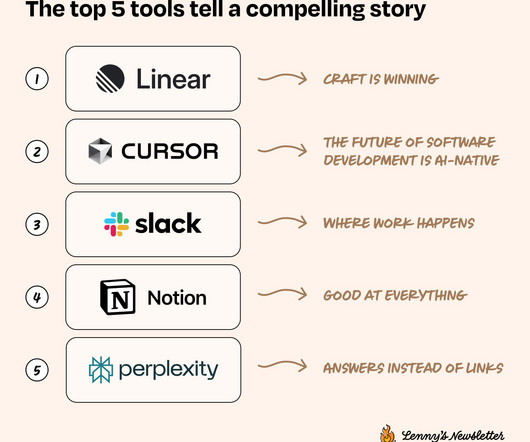
Subscribe now For more: Lennybot | Podcast | Swag | Hire your next product leader | My favorite courses I’ve always been fascinated by what tools people choose to use in their work. ” we asked people what tools they most love, what tools frustrate them, and what they’d change if they could. 5% use Bolt.
A shift from the on-premise legacy systems, it aimed to provide a faster, scalable, and more cost-effective way 0f storing and analyzing data. They think a modern data stack only requires combining multiple tools and systems to handle data processing. It's just upgraded tools leading to the same data complexities and silos.
We organize all of the trending information in your field so you don't have to. Join 96,000+ users and stay up to date on the latest articles your peers are reading.
You know about us, now we want to get to know you!
Let's personalize your content
Let's get even more personalized
We recognize your account from another site in our network, please click 'Send Email' below to continue with verifying your account and setting a password.


Let's personalize your content