This site uses cookies to improve your experience. To help us insure we adhere to various privacy regulations, please select your country/region of residence. If you do not select a country, we will assume you are from the United States. Select your Cookie Settings or view our Privacy Policy and Terms of Use.
Cookie Settings
Cookies and similar technologies are used on this website for proper function of the website, for tracking performance analytics and for marketing purposes. We and some of our third-party providers may use cookie data for various purposes. Please review the cookie settings below and choose your preference.
Used for the proper function of the website
Used for monitoring website traffic and interactions
Cookie Settings
Cookies and similar technologies are used on this website for proper function of the website, for tracking performance analytics and for marketing purposes. We and some of our third-party providers may use cookie data for various purposes. Please review the cookie settings below and choose your preference.
Strictly Necessary: Used for the proper function of the website
Performance/Analytics: Used for monitoring website traffic and interactions
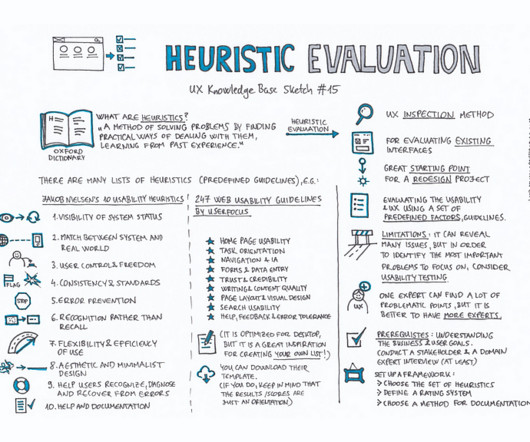
Known as the Martech 5000 — nicknamed after the 5,000 companies that were competing in the global marketing technology space in 2017, it’s said to be the most frequently shared slide of all time. The reasons for this growth – high-velocity economics of software innovation, the migration of money from old media to new media, etc.
G2 has named Indicative as a Leader in Customer Journey Analytics in G2’s 2020 Summer Report. . Indicative is the only Customer Analytics platform designed specifically for non-technical business users that connects directly to your data warehouse. Easy to use tool for funnel analysis that connects to Segment for event data.
Tracking cross-platform analytics is essential for product teams to see a complete view of customer behavior. TL;DR Cross-platform analytics is the activity of tracking and analyzing user behavior across multiple platforms or devices. Tools like Google Analytics or Amplitude allow you to track user behavior across all platforms.
In 2019, industry-leading Business Intelligence tools (BI tools), Looker and Tableau, were acquired by Google and Salesforce for over $18 billion combined. These massive deals show that BI tools and data warehouses are a powerful combo that companies across the globe are incorporating into their tech stacks.
This is where tools such as Reveal and Looker come in handy – they convert raw data into easy-to-understand and easy-to-use insights that enable organizations to reshape and modernize the way they do business. What is Looker? What Is Looker? Reveal VS Looker – Comparing Features & Functionalities.
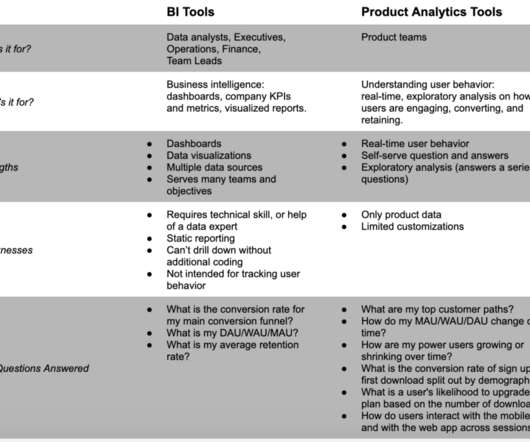
From understanding the analytics landscape to mapping capabilities with KPIs and integrating new tools with your current stack, we know that choosing a product analytics solution can be overwhelming—not to mention, time-consuming. How is Mixpanel different from marketing analytics tools like Google Analytics?
Let’s start, Google Analytics 4 is a powerful web analytics service that provides valuable insights into user behavior, engagement, website conversion, and much more. Exploration Reports : GA4 offers exploration reports for advanced and customized data analysis, giving you deeper insights into user behavior. It’s six years old.
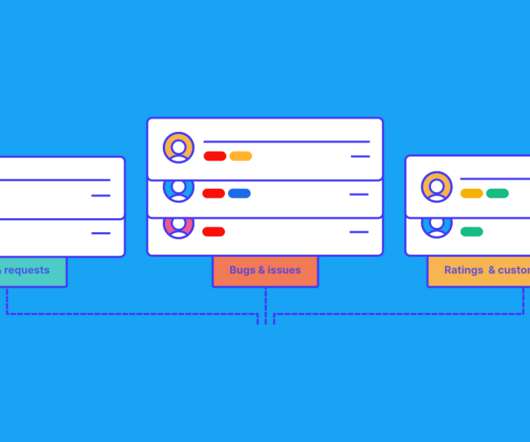
You can collect customer feedback in a variety of ways: Messenger tools Social media Email. You can easily write out a generic understanding of what you see in your customer feedback software. That’s why we recommend proper tools that help you receive specific and actionable insights. Better products and services.
An analyst or analytics engineer is responsible for modeling the data and will care about its structure, and you might have several teams responsible for building reports and analysing the data in several tools (e.g. Looker and Mixpanel). Software Engineer. Roland Meyer. A reminder - good PMs don’t need to know SQL.
Where does product analytics fit in the realm of analytics tools on the market? Hint: Skip to 3:45 to learn how Amplitude compares to BI tools and marketing analytics.). Because Amplitude as a company, we think we are really the only analytics platform that’s built ground up to help producting succeed. I need to be on the web.
Where does product analytics fit in the realm of analytics tools on the market? Hint: Skip to 3:45 to learn how Amplitude compares to BI tools and marketing analytics.). How Amplitude differs from BI tools and marketing analytics (and other questions) Click To Tweet. You can find a full transcript below.
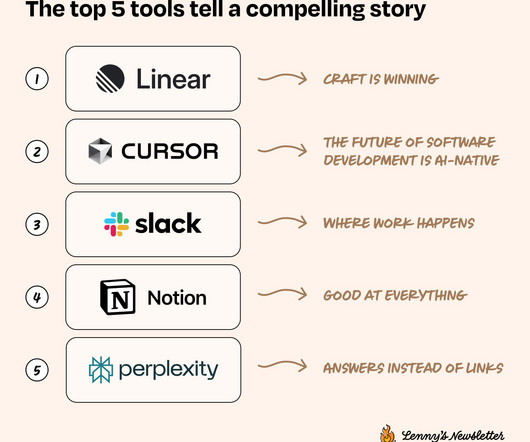
Subscribe now For more: Lennybot | Podcast | Swag | Hire your next product leader | My favorite courses I’ve always been fascinated by what tools people choose to use in their work. ” we asked people what tools they most love, what tools frustrate them, and what they’d change if they could. 5% use Bolt.
We organize all of the trending information in your field so you don't have to. Join 96,000+ users and stay up to date on the latest articles your peers are reading.
You know about us, now we want to get to know you!
Let's personalize your content
Let's get even more personalized
We recognize your account from another site in our network, please click 'Send Email' below to continue with verifying your account and setting a password.


Let's personalize your content