This site uses cookies to improve your experience. To help us insure we adhere to various privacy regulations, please select your country/region of residence. If you do not select a country, we will assume you are from the United States. Select your Cookie Settings or view our Privacy Policy and Terms of Use.
Cookie Settings
Cookies and similar technologies are used on this website for proper function of the website, for tracking performance analytics and for marketing purposes. We and some of our third-party providers may use cookie data for various purposes. Please review the cookie settings below and choose your preference.
Used for the proper function of the website
Used for monitoring website traffic and interactions
Cookie Settings
Cookies and similar technologies are used on this website for proper function of the website, for tracking performance analytics and for marketing purposes. We and some of our third-party providers may use cookie data for various purposes. Please review the cookie settings below and choose your preference.
Strictly Necessary: Used for the proper function of the website
Performance/Analytics: Used for monitoring website traffic and interactions
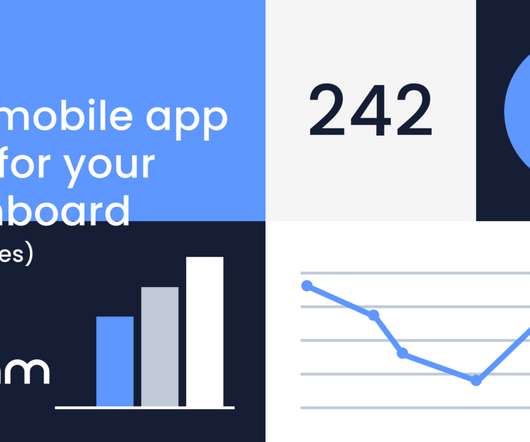
Learn about the importance of mobile app KPI dashboards and copy dashboards from real mobile app product managers, engineers and designers. A key performance indicator (KPI) dashboard is a visual representation of data that quantifies how well a team is performing towards its goals. How do I create a mobile app KPI dashboard?
A close look at key performance indicators (KPIs) and the impact they have on the efficacy of User Experience (UX). A great understanding about how KPIs can inform your UX research on both a qualitative and quantitative level. The post How to assess the efficacy of UX: KPI methods appeared first on TryMyUI Blog.
You’ll find yourself working closely with UX and UI designers throughout your career as a Product Manager. The last thing you want to do when talking to a designer, is to use UX and UI interchangeably. Or that an OKR is the same as a KPI. You may also be interested in: Why UX Is Essential for PMs What Is UX?
In this article, you will learn: What is a KPI in SaaS? KPIs vs. Metrics. Why is it so important to track KPI, metric, or measure? A key performance indicator (KPI) is a measurable value that shows how effectively a company is meeting key business objectives. When you add context to a metric, you get a KPI.
Do you need some behavioral KPI examples to understand what metrics to track and why? Behavioral key performance indicators (KPIs) can help you understand user experience and measure feature adoption. TL;DR Behavioral KPIs refer to metrics that track and measure customer behavior and engagement with your products or services.
It is an indispensable KPI because it indicates how many of your users have stayed loyal. . This metric is difficult to grow organically; therefore, retention numbers should be a major KPI from day one. This is a strong indicator that you’re doing a great job with your app’s targeting and UX design. Session statistics.
Figure 2: The People Involved in the Strategy Work The team in Figure 2 consists of the person in charge of the product, a UX designer (for end-user-facing products), an architect/programmer, and a tester, as well as the key business stakeholders. 3] This leverages their expertise, creates strong alignment, and maximises buy-in.
better UX higher conversion increased revenue). Commonly usedmetrics Heres a list of some of the most commonly used metrics in productdesign: Commonly used metrics in productdesign When to use OKRs vsKPIs OKRs and KPIs play distinct roles in measuring product designsuccess. OKRs help set goals while KPIs validate progress.
UXKPIs, or user experience key performance indicators, are essential numerical data points that are used to track, measure, and compare the experience users have with your SaaS product. So, if you’re a product manager looking to significantly improve your UX efforts and provide actionable insights to your UX team, read on!
Product managers are aware of the basic KPI metrics to measure for their mobile app, but there are a handful of underestimated KPI metrics that product managers need to measure as well. An important KPI metric to focus on here is the average time between each consecutive step.
In this ProductTank San Francisco talk, Doug Puett, Head of Data Science at UserTesting, and I share how our data science and UX research team worked collaboratively to conduct retention analysis, customer segmentation, and cohort definitions. Many teams might immediately jump to finding solutions that will help move toward that KPI.
New features, improving performance and addressing UX issues can’t be ignored in order to please the loudest voice in the room. At FreeAgent, as soon as a KPI goes red, a team can switch off whatever they’re doing and divert resource to fix it. Product considerations must still be looked at.
For decades, user experience professionals have been debating how to associate experience measures with these key KPIs. When attempting to make these associations UX practitioners struggle to consistently associate research findings to concrete KPIs. How practitioners can make experience a critical KPI for their organization.
Make UX A Part of the KPI Conversation With Universal Measures. Make UX A Part of the KPI Conversation With Universal Measures Key Performance Indicators or KPIs are basic measures that are often front in center in most board rooms. ON-DEMAND WEBINAR. About the webinar speaker.
What are KPIs? KPI stands for key performance indicators , and they are a way for you to understand the performance against the key results that you have set. Let's tap into our examples again and look at how we might understand performance with a KPI example added: Real-world example: Objective: Reduce body fat %.
Therefore, I have asked six of UserZoom’s brightest minds (who also happened to be willing to stake their hard-earned reputations on these predictions) about how they think the CX and UX landscapes will shape up in 2020. Moreover, we will see CX and UX pros partnering more to obtain a better holistic picture of the overall experienc e.
Your SaaS’s Activation Rate is the percentage of users who get to that key event – and a lot of studies have found it to be that optimizing your Activation Rate has the greatest downstream impact on revenue of any KPI you should be tracking. So contextual experiences are critical in successful UX. Adjacent Users.
So, what is the compass that guides a product manager when making product decisions (new functionality, UX, UI)? It’s not a roadmap or a KPI. When the product team designed the new dashboard we had many product/UX dilemmas – which functionality to expose and how to present it. This compass is known as product principles.
There are many ways to approach this, but my favorite is how Duolingo created a Markov model around their main business KPI (DAUs) to grow it. In the same way, you can start from your business KPI and then break it down into sensitive metrics you can act on. Communication is key here.
OKR vs KPI Before we dive into individual parts of OKR, it’s essential to explain the difference between KPI and OKR. Many people believe that KPI and OKR are the same thing, which is untrue. KPI and OKR serve different purposes. KPI and OKR. KPI helps us evaluate how well something is working in our organization.
CUSTOMER KPI: Reach. BUSINESS KPI: Reach as a % of Total Addressable Market (TAM). CUSTOMER KPI: Time to deal close. BUSINESS KPI: Maps to sales booking goals. CUSTOMER KPI: Time to the first use of the critical feature. BUSINESS KPI: Time to goal monthly recurring revenue (MRR). Phase 2: Evaluate & buy.
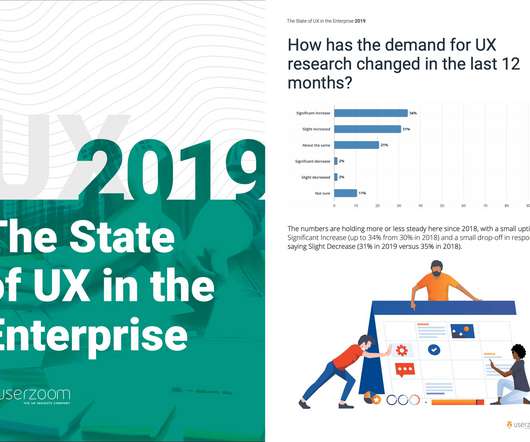
What are the top challenges that UX professionals will face in 2020 and what can we do to solve them? Over the last couple of years we’ve surveyed hundreds of people from some of the biggest companies in the world to discover the current UX landscape in enterprise organizations.
It is an indispensable KPI because it indicates how many of your users have stayed loyal. This metric is difficult to grow organically; therefore, retention numbers should be a major KPI from day one. This is a strong indicator that you’re doing a great job with your app’s targeting and UX design.
Go ahead and skip directly to the product marketing KPIs list or continue to read if you’re just starting out and looking to understand more about what product marketing is first. What is a Product Marketing KPI metric? Product Marketing KPIs vs Product Marketing OKRs. What is a Product Marketing KPI metric?
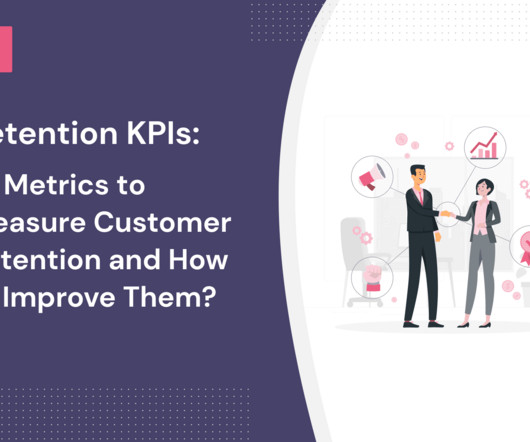
As companies usually have many different KPIs, maintaining or growing customer retention is a key KPI that each business commonly shares. You might also be interested in Mobile app KPI dashboard examples and how to use them What is customer retention and why is it so important? a leading Buy Now, Pay Later solution.
We gather the feedback from our users, sales, R&D, UX and based on that we build our product’s puzzle: What should we do next?—?build We use the data we gather to try and understand what our users want, need, do. We also use this data to analyze the features we’ve released, and how they impact our product?—?like
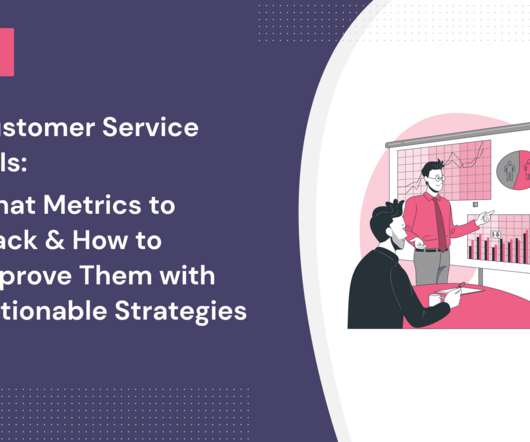
Having trouble deciding which customer service KPI to use? There are some vanity metrics among the KPIs for customer service. So let’s look at the most important KPIs that will help you create strategies to provide superior customer service and boost retention. Customer service KPI #1 Customer Satisfaction Score.
A crew’s happiness is directly related to the quality of their outputs and so is measured as any other KPI would be. Within their design tribes, UX + UI + Research means you are a full stack designer. At Moo, tribes are collections of crews who focus on particular problems.
10 Customer retention KPIs and metrics to measure retention. Here are 10 of the most important KPIs and metrics that help you measure customer retention rate. Retention KPI #1 Customer retention rate. Retention KPI #2 Monthly recurring revenue. Retention KPI #3 Customer lifetime value. product tutorials.
There are various formats and designs to help you build a solid vision, including the Lean UX Canvas by Jeff Gothelf and the Business Model Canvas by Alexander Osterwalder. A key result is not the same thing as a KPI (key performance indicator). A KPI is used to measure the continued progress towards a defined performance measure.
To collect the data to measure this KPI, you need to define what activities make up an “aha moment.” You can use this KPI to identify places where you may need to set user expectations during your onboarding process. Breadth of adoption shows the initial appeal of a new feature. Clear messaging.
User Experience is a key factor regarding the success of a digital product, and the main ingredient to an excellent UX lies in a thorough user-centered approach. In that sense, Imaginary Cloud is introducing a new UX Audit service focused on providing high-quality professional UX Audits. What is a UX Audit? Conclusion.
This article will outline some helpful metrics and key performance indicators (KPIs) that you can use to help measure and improve your user experience. The post 7 ways to measure user experience using metrics & KPI’s appeared first on TryMyUI Blog.
SaaS User Persona Example-Userpilot: UX Designer 5. Like – my user persons is: “a SaaS product marketer who works for a large company and is in charge of increasing first-month retention” or “a UX product designer in a UX team, who is in charge of prototyping, building, and optimizing the onboarding user flow”.
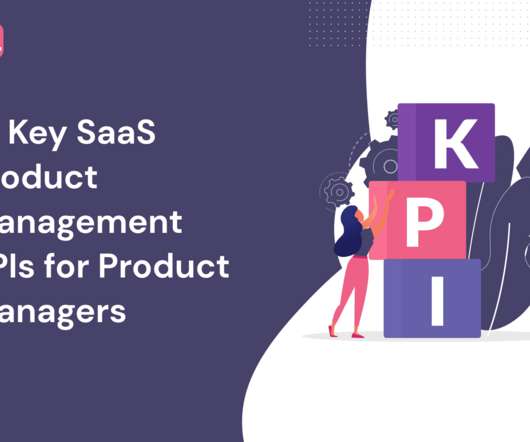
Best way to track and measure product management KPIs. Product management KPIs help product teams outline and track the business or product success. KPI stands for Key Performance Indicator, and OKR stands for Objectives and Key Results. What’s the difference between KPIs and OKRs? Let’s get started!
OKRs are different from KPIs because a KPI is strictly a metric that reflects performance. There are two main performance frameworks in product marketing – OKRs and KPIs. Meanwhile, a KPI is a single metric that gives a reflection of performance in one area.
HandyKPI uses mobile technology to make tracking business and team performance easy, offering real-time KPI monitoring through a comprehensive app. Custom Dashboards : Enables the creation of custom KPI dashboards tailored to your specific metrics and visualization options. View product usage with Userpilot.
We have a centralised product group (product management, product marketing, engineering, UX, PMO) that is in part geographically dispersed which covers 10 product lines, and we’re in the process of dramatically diversifying our portfolio and driving our business to a new phase of growth.
Digging into the data, California stands out as an interesting case of not taking the first KPI as a win. The post Four key highlights from our Competitive Healthcare UX Benchmark appeared first on UserZoom. In the meantime, here are four of the key highlights from the benchmark.
Participate in every aspect of product design (not talking about just UX/UI here), but this subtle distinction is key to not lose focus on the big picture. Long term, you can expect to manage a specific KPI (e.g., You understand that your goal is to achieve business outcomes through measurable product initiatives.
I summarize the impact that the redesign had, breaking down the major KPIs, and showing how the feedback materialized into KPI home runs with behavioral data to back it up. Often times, the features we build fail to get traction with our customers. This was not the case with the wish list. Fine Tuning the Machine.
This is a guide for UX and research practitioners who have either newly joined an organization that’s using the Agile methodology, or their current product development is adopting Agile for the first time and they’ve been told to “make UX research happen in this new fangled process immediately please!” . This is a false economy.
So follow these rules: Product Analytics KPIs 101a: Articulate Your Business Goals. If it generates revenue, then revenue should definitely be a KPI! Bear in mind, there are likely to be a lot of stakeholders in your business outside the product team who deserve to be consulted at this stage of the KPI setting process.
We organize all of the trending information in your field so you don't have to. Join 96,000+ users and stay up to date on the latest articles your peers are reading.
You know about us, now we want to get to know you!
Let's personalize your content
Let's get even more personalized
We recognize your account from another site in our network, please click 'Send Email' below to continue with verifying your account and setting a password.


Let's personalize your content