This site uses cookies to improve your experience. To help us insure we adhere to various privacy regulations, please select your country/region of residence. If you do not select a country, we will assume you are from the United States. Select your Cookie Settings or view our Privacy Policy and Terms of Use.
Cookie Settings
Cookies and similar technologies are used on this website for proper function of the website, for tracking performance analytics and for marketing purposes. We and some of our third-party providers may use cookie data for various purposes. Please review the cookie settings below and choose your preference.
Used for the proper function of the website
Used for monitoring website traffic and interactions
Cookie Settings
Cookies and similar technologies are used on this website for proper function of the website, for tracking performance analytics and for marketing purposes. We and some of our third-party providers may use cookie data for various purposes. Please review the cookie settings below and choose your preference.
Strictly Necessary: Used for the proper function of the website
Performance/Analytics: Used for monitoring website traffic and interactions
When it comes to KPIs vs metrics, which one should you measure to get better insights? What about metrics and measures? Metrics and KPIs are often used interchangeably, but they also have differences. The more you understand these nuances, the better you can evaluate your product growth strategy.
Do you need some behavioral KPI examples to understand what metrics to track and why? Behavioral key performance indicators (KPIs) can help you understand user experience and measure feature adoption. Tracking behavioral KPIs is essential for understanding customers and improving their user experience with your products.
Are you tracking the right Product Marketing KPIs? With so many product growth insights available to every product marketer, it’s sometimes hard to understand which metrics are relevant and which you should be tracking to measure the success of your product marketing. What is Product Marketing?
Looking for the right retention KPIs to track and improve your customer retention rates? Customer retention is the key ingredient when it comes to growing your SaaS product without having to acquire new customers. So let’s find out what retention KPIs you should start tracking! What are retention KPIs in SaaS?
Wondering what customer journey KPIs align with your business goals? Customer journey KPIs, alongside product analytics , help product teams understand if they’re meeting their goals. SEO ranking to monitor and improve product visibility on search engine results.
Wondering which product management KPIs help you get better product growth insights ? Among the plethora of responsibilities that SaaS Product Managers have, defining and tracking KPIs probably is the most influential towards guiding future product development. Key product management metrics and KPIs.
How do you make sure your product marketing team is actually working toward success? By using product marketing OKRs to guide strategy and track progress. But when it comes to products, you can’t ignore the rest of the funnel. This article is focused on product marketing OKRs and how they help product teams drive adoption.
How do you track SaaS funnel metrics in each stage and improve them? Developing and optimizing sales funnels is a key part of SaaS product growth. There are a variety of metrics you can use to optimize your sales funnel, but today we’ll be focusing on what matters most. What are funnel metrics?
To build a business model that can help your startup make waves in a crowded marketplace, consider Henrique Boregio’s approach: stop chasing “feature parity” and focus on creating something truly unique. What is your North Star metric and how has it changed over time? What is your North Star metric and how has it changed over time?
To build a business model that can help your startup make waves in a crowded marketplace, consider Henrique Boregio’s approach: stop chasing “feature parity” and focus on creating something truly unique. What is your North Star metric and how has it changed over time? What is your North Star metric and how has it changed over time?
UX KPIs, or user experience key performance indicators, are essential numerical data points that are used to track, measure, and compare the experience users have with your SaaS product. So, if you’re a product manager looking to significantly improve your UX efforts and provide actionable insights to your UX team, read on!
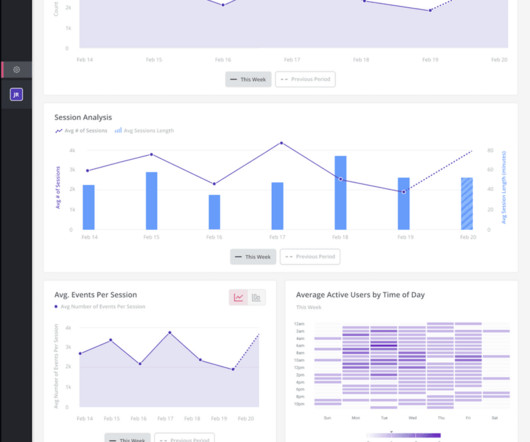
Without product analytics, how do you know how to move the needle with your product growth? If you’re only beginning your adventure with product analytics, looking at all the usage data may seem overwhelming at first glance: Source: Heap. Here are the need-to-know takeaways: What is Product Analytics?
Customer satisfaction analytics are key to understanding what makes your customers happy and building a product that retains users. But how can you leverage this user sentiment data to lead product development and grow your business? There’s no single KPI to measure customer satisfaction.
The top metrics to measure customer growth rate. Five customer growth strategies to implement: Help users discover features relevant to them. Drive engagement and product adoption with product guides. Increase new customer acquisition by incentivizing existing customers to refer others. What is customer growth?
Monthly active users (MAUs) refer to the number of unique visitors that engage with your web or mobile app in a month. Daily active users (DAU) are the total number of unique visitors who use your product’s core features daily. actively using your product). actively using your product). How to measure MAUs.
Wondering what key performance indicators SaaS companies should look out for to enhance their product growth ? For a new SaaS business, the main challenge lies in determining the most important KPIs to track. The three main types of KPIs are quantitative, qualitative, and leading KPIs. Leading KPIs.
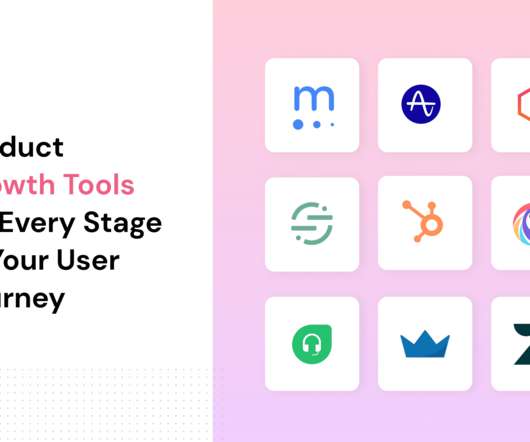
What are the best tools for user activation and feature adoption? What tools should I use to boost my feature engagement? We get these questions *a lot* in our Product Growth and Retention group (go check it out, BTW.!), Product Growth requires improving your different ‘Pirate Metrics’ and that calls for several tools.
TL;DR Customer feedback forms gather user insights and sentiments that allow you to improve your product/service. Collecting customer feedback helps to build user-centric products, measure satisfaction, identify areas for improvement, and boost user retention. Track overall satisfaction with your product or service.
If you want to build a loyal customer base and nurture product growth , your focus should be spent on making users realize the value of your product as soon as possible—which might be trickier than you think. Value realization is when a customer experiences and recognizes the value of your product or service. Time to live.
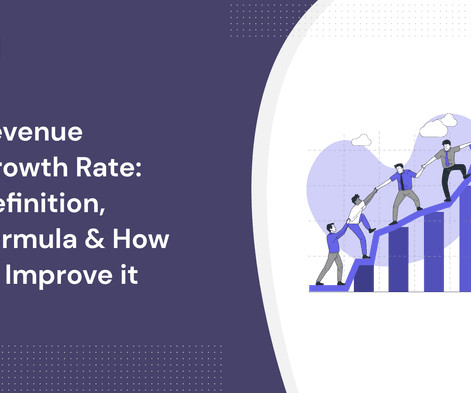
Related metrics that impact your revenue and how to use the insights to turn your product into a growth engine. TL;DR Revenue growth refers to the increase in a company’s total revenue or income over a specific period, typically calculated quarterly or annually, but you can also calculate monthly or weekly revenue growth.
What is Product Adoption? Product adoption, sometimes called user adoption, refers to the use of a product or feature that results in accomplishing a product’s intended goals to achieve anticipated benefits. Users might be brand-new to the product or existing users of a product with a new feature update.
Managers and product managers are often frustrated by the apparent lack of care the development team is showing for the needs of the business. When a long-awaited product or feature finally launches, it often comes well short of the needs. For many organizations the solution is product management. The bigger context?—?users,
Realeasing a new feature and expecting your users to just ‘pick it up’ is like going to China and expecting to ‘just pick up Chinese’. You need to help your users adopt the new features, regardless how far they are in their user journey. If nobody knows you’ve launched a new feature, you can’t expect anybody to start using it.
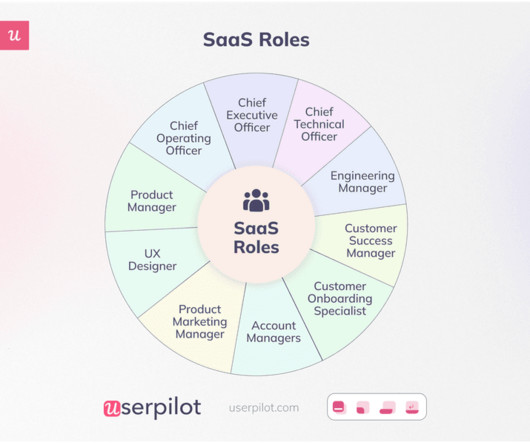
In this article, we’ve outlined the major roles that move the needle in terms of product growth alongside their KPIs and current salary ranges. Product Manager : In charge of creating product strategy and overseeing the design process, among other things. Average salary: $151,254/yr. Average salary: $111,208/yr.
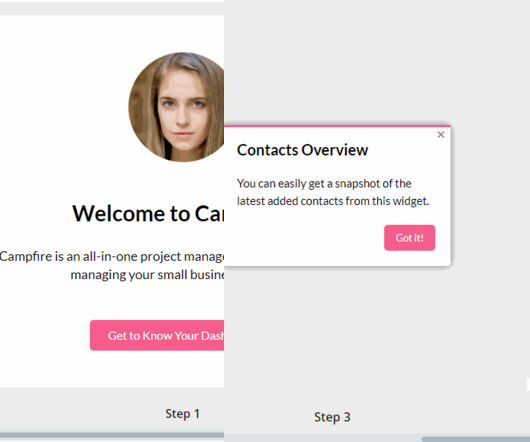
If you’re a long-time product manager, you’ll know that your product walkthrough can make or break your SaaS business. The key objective of a good product walkthrough is to promptly direct the user to their first “Aha Moment,” thereby maximizing the odds of both activation and Day 1 retention. What is a Product Walkthrough?
Are you wondering what customer experience KPIs and metrics you should track? Choosing the right KPIs can make all the difference when it comes to retaining your customers in the SaaS business. Customer experience Key Performance Indicators are the metrics that measure the level of interaction between the company and customers.
A customer satisfaction survey is a lynchpin to developing a loyal, returning, and referring customer base. Best Practices and Examples For Interest-Based Questions Demographic Best Practices and Examples Product Usage Best Practices and Examples Are You Using the Best KPIs For Your Customer Satisfaction Survey?
Working as a product manager can be a busy, unpredictable and octopus-like existence. Bringing team members together, organizing user research, product demos, road mapping and more. If you’re a mobile app product manager there’s a whole additional layer of complexity to add to that cake. What features are most important to them?
As a product manager, it’s normal to get all kinds of new feature requests from stakeholders (these requests are usually related to pain points). Or do you try to implement each feature request, leaving you with half-baked projects with an archive of features and no finished product? Let’s dive deeper!
Now it’s time for onboarding, collecting feedback, increasing usage, and eventually winning the renewal. The delightful experiences create demand and enthusiasm for the product. They make excellent references and spread the word about how awesome your product is. Creating a Perpetually Positive Product Experience.
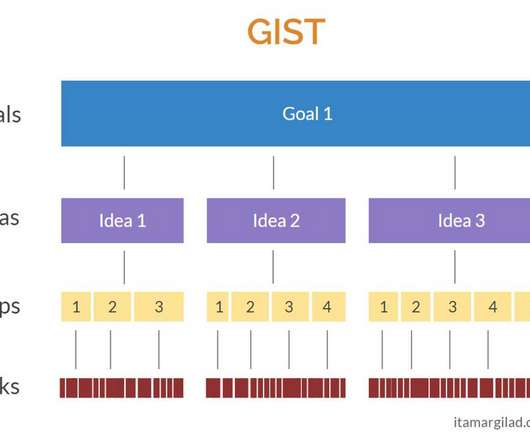
You want to make sure everyone is 100% onboard with the changes that are coming. You might already be using KPI’s for individuals, so make sure that when you talk about the move to OKRs, you are sensitive to the fact that change management, in any capacity, is hard to do well. You get it by selling products or making users happy.
In many instances, TPM candidates are asked to think through and design a product's system architecture. These kinds of questions evaluate your ability to think and work through technical dependencies, product context, execution strategy, and impact on a team. How would you design an AI data product?
Product adoption has picked up a fair amount of jargon over the years. And since new fancy terms seem to pop up every week, it can be a bit hard to navigate for both the newcomers and even for the well-established product pros. Hence: team Userpilot has put together the ultimate guide to product adoption and onboarding terminology!
Focused on democratizing access to data-driven decision making, Customer Analytics tools empower non-technical users (like marketing and product teams) to make sense of all the data. Common features. Common Customer Analytics Features. KPI tracking – Easily track KPIs, create dashboards, and visualize your analysis.
From major players in the field such as Delphix and ADP to Okta, Lumen, and Glint, get ready to hear about Customer Success Operations, CS at Scale, CS Strategy, Human First Customer Success, and Product Experience. Our speakers confirmed that the more targeted the onboarding and adoption programs, the better.
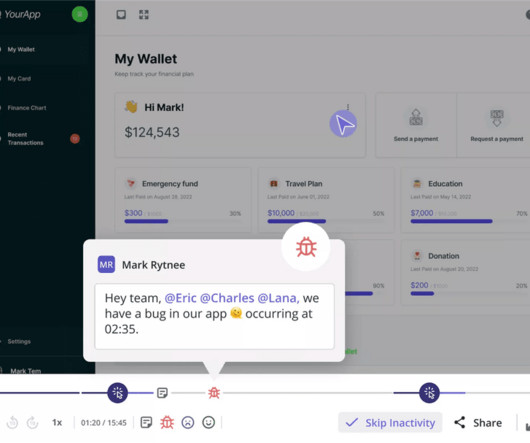
Analytics can tell me where users drop off or which features they avoid, but they dont reveal the experience behind those actions. This confirmed that it was a friction point and then we quickly changed the placement in the product for better usability. Numbers can show you whats happeningbut not why.
We organize all of the trending information in your field so you don't have to. Join 96,000+ users and stay up to date on the latest articles your peers are reading.
You know about us, now we want to get to know you!
Let's personalize your content
Let's get even more personalized
We recognize your account from another site in our network, please click 'Send Email' below to continue with verifying your account and setting a password.


Let's personalize your content