This site uses cookies to improve your experience. To help us insure we adhere to various privacy regulations, please select your country/region of residence. If you do not select a country, we will assume you are from the United States. Select your Cookie Settings or view our Privacy Policy and Terms of Use.
Cookie Settings
Cookies and similar technologies are used on this website for proper function of the website, for tracking performance analytics and for marketing purposes. We and some of our third-party providers may use cookie data for various purposes. Please review the cookie settings below and choose your preference.
Used for the proper function of the website
Used for monitoring website traffic and interactions
Cookie Settings
Cookies and similar technologies are used on this website for proper function of the website, for tracking performance analytics and for marketing purposes. We and some of our third-party providers may use cookie data for various purposes. Please review the cookie settings below and choose your preference.
Strictly Necessary: Used for the proper function of the website
Performance/Analytics: Used for monitoring website traffic and interactions
In this article, you will learn: What is a KPI in SaaS? KPIs vs. Metrics. Why is it so important to track KPI, metric, or measure? A key performance indicator (KPI) is a measurable value that shows how effectively a company is meeting key business objectives. When you add context to a metric, you get a KPI.
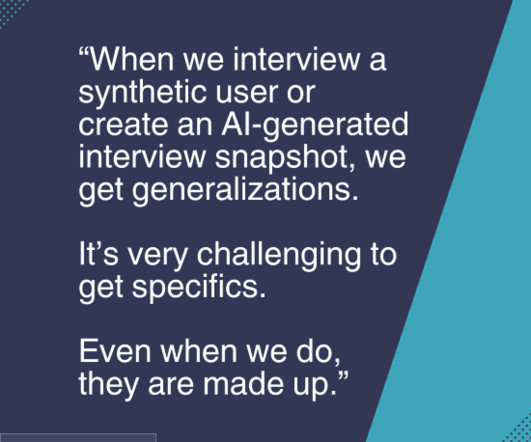
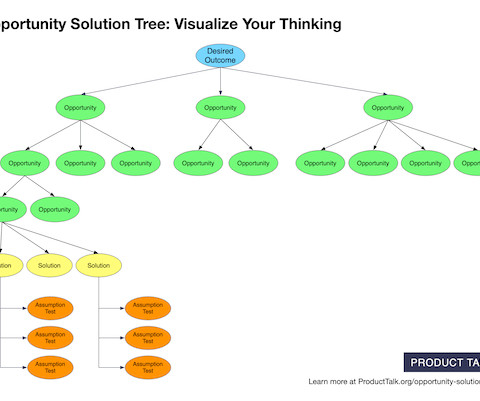
The better we understand our customers, the better we can meet their needs, and the more we can differentiate our product from the competitors. Along the way, we might create interview snapshots, experience maps, opportunity solution trees, story maps, KPI trees, or other visual artifacts. But these artifacts are not the end goal.
This is what will help differentiate your solution from just a "vitamin" to being a "pain killer" if you are addressing problems so painful that any improvement to the problem space would be a welcome addition to your target audience. Strategic Differentiation. Competition. Acquisition Strategy.
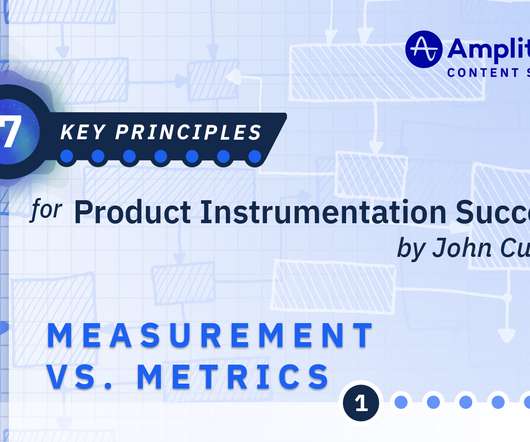
The National Institute of Science and Technology differentiates measures and metrics as follows: “We use measure for more concrete or objective attributes and metric for more abstract, higher-level, or somewhat subjective attributes”. Steps (a big deal for Fitbit users, maybe more of a KPI). Measurement vs. Metrics. Resting heart rate.
According to Gartner, more than 3,000 CIOs ranked Business Intelligence (BI) and Analytics as the top differentiating technology for their organizations. Historically, business users have been presented with dashboards that describe the current state of a KPI, i.e. Net Profitability, Customer Retention, and more. How does it work?
Companies differentiate themselves from competitors by building a richer understanding of the opportunity space. Compare and contrast when there’s risk in the solution, when the opportunity is a differentiator, or you need to uncover an innovative solution. What is an opportunity? In reality, we don’t always have time to do this.
The Role of Data in Defining Your North Star Metric How the Right North Star Metric Can Illuminate Your Business Path A North Star metric is a key performance indicator (KPI) that a company uses as the leading measure of its success. The term is derived from the North Star (Polaris), which mariners historically used as a navigation guide.
As companies usually have many different KPIs, maintaining or growing customer retention is a key KPI that each business commonly shares. You might also be interested in Mobile app KPI dashboard examples and how to use them What is customer retention and why is it so important?
As things shift from inner workings and move towards communication with customers, the main challenge for product managers becomes differentiating between routine daily tasks that move things forward and the ones that are hindering the project. A solid KPI dashboard allows you to turn a mush of data into actionable insights and directions.
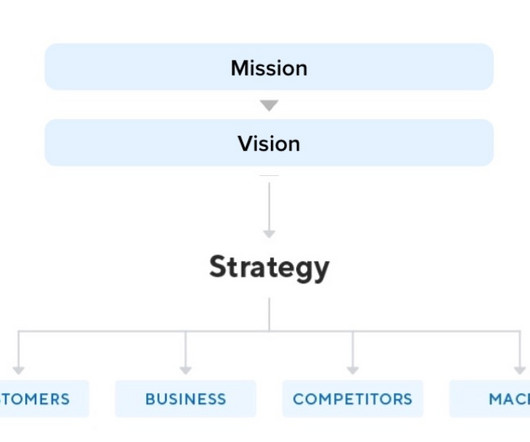
The product’s key differentiators or unique selling proposition. A key result is not the same thing as a KPI (key performance indicator). A KPI is used to measure the continued progress towards a defined performance measure. How do you set a product vision? The company’s business goals for the product.
Outline your unique value proposition (UVP) and come up with a differentiation strategy to help differentiate your product. Set SMART goals and KPIs for your team to keep track of their progress and drive the product development process. These are measurable metrics that help you determine whether a goal has been achieved.
As CTO at Primephonic , the Amsterdam-based music streaming service sometimes called “the Spotify of classical music,” Henrique Boregio has channeled this approach into his company’s product roadmap, focusing his team and resources on building differentiated features for the niche market segment.
As CTO at Primephonic , the Amsterdam-based music streaming service sometimes called “the Spotify of classical music,” Henrique Boregio has channeled this approach into his company’s product roadmap, focusing his team and resources on building differentiated features for the niche market segment.
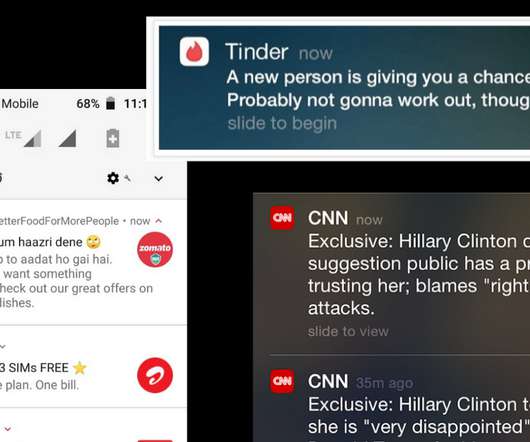
You can either have a different channel name or a key-value pair to differentiate. Horses for Courses A different notification layout for each content type in the app can work wonders. Configuring a flag from the push notification dashboard is pretty simple.
Gartner differentiates between two kinds of of real-time analytics: On-demand real-time analytics waits for a user to request a query and only then provides the analytics results Continuous real-time analytics analyzes data continuously and sends alerts to users whenever certain events happen. What is real-time analytics?
Idea creation : Use ChatGPT to generate new feature ideas , campaigns, blog post topics, product differentiation ideas, and more. How can we differentiate our product from existing solutions? price matching, undercutting, or differentiation)? Analyze our user engagement KPIs and provide insights into improving them.
Teams are measured against how they help to create an integrated set of activities that helps the company win, and are not solely celebrated for the short lived local KPI uptick that is presented in quarterly business reviews. The creation of a sustainable competitive advantage becomes the focus.
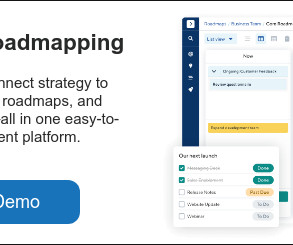
Yet the customer experience continually improves while KPI targets come into view. It also provides more visual ways to ensure your roadmap has the right balance between big bets and incremental gains and differentiates between the lengthier timelines big bets demand and the rapid-fire short-term wins that get cranked out on the regular.
It was also challenging to figure out how to bring continuity between each of those channels so that people understand what we represent and then reflecting it in our key performance indicators (KPIs). Nick: Can you elaborate on the KPI concept for the participant side? . It’s an exciting and tough challenge.
Loyalty segmentation differentiates customers based on their loyalty levels to identify product advocates. Are you looking to improve product KPI , tailor marketing messages, or identify new market opportunities? Psychographic segmentation groups individuals according to their lifestyles, interests, and personality traits.
Goal setting and KPI monitoring : Marketing analysis involves interfacing with stakeholders, other members of the marketing team, and sometimes users in the process of research. KPI monitoring also helps you keep track of your performance and identify where you are lagging and where to improve.
To start with, you need to choose a KPI for each dimension that you will use to rank the customers. Such detailed segmentation doesn’t make sense unless you are able to differentiate your approach for each of them. Steps to perform an RFM analysis. The RFM analysis consists of 4 main stages. Define your model.
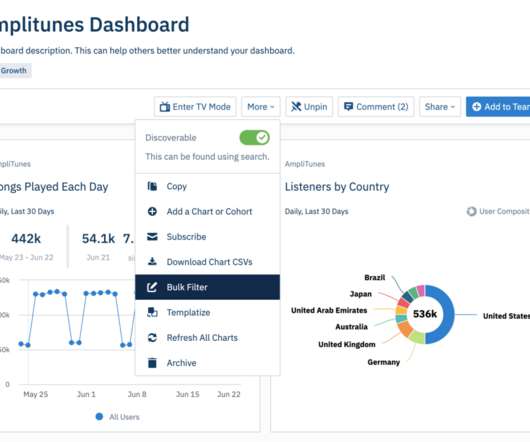
Now they monitor 5th workout as a KPI in Amplitude, and make product bets to help users get there faster. Historical Count is more accurate than just differentiating between new and returning users.
Looking at one KPI can sometimes be enough, but it often represents only one part of a bigger story. This allowed Shiseido to run differentiated A/B tests and personalize their website depending on the expected lifetime value of the user, resulting in a 12.6% Here, AI can facilitate the process by analyzing large datasets (e.g.,
But what happens when there’s a separate set of Key Performance Indicators ( KPI s) from one department to the other? However, if you’re in the business of a technology-based product customers will not differentiate these disparate experiences from the product itself. Lack of shared goals.
Digging into the data, California stands out as an interesting case of not taking the first KPI as a win. 28% weren’t sure which plan was best for them, 24% found it difficult to find plan details and 20% found it difficult to differentiate between plans. Compare healthcare plans and select one that will meet your needs.”.
This deep dive into data is the key differentiator between a data PM and a traditional PM. . Related terms: Objectives and Key Results (OKRs) , Key Performance Indicator (KPI) , Prioritization , Retention , Impact Mapping , A/B Test , Beta Test , Roadmap. To a data PM, data is the product. . How Does a Data Product Manager Use Data?
Looking at the Technology Adoption Lifecycle Model, your LTV is a major KPI once in the Early Adopters phase—just before the chasm. A key differentiator between SaaS businesses and traditional software product orgs, is the fact that revenue doesn’t come in one-off purchases. When is this metric useful for SaaS PMs?
To craft unique experiences, youll need to differentiate these seven phases customers pass through and understand how to animate their digital journey. Optimizing your checkout sequence for your audience withrollouts and KPI-triggered rollbackscan help you find a seamless fit for your website.
Design patterns and industrial technology study help existing players to leverage their expertise and practice to differentiate your product/design. " These scores in the UX Audit report don't indicate a specific proportion of impact on KPI goals. Evaluation.
Plus, it ensures your product/design differentiation. On the one hand, the "issue impact" score explains the potential negative impact of the issue regarding the KPI goals. In that sense, research on design patterns and the industry's most used technologies allows leveraging existing players' knowledge and practice.
Yet the customer experience continually improves while KPI targets come into view. It also provides more visual ways to ensure your roadmap has the right balance between big bets and incremental gains and differentiates between the lengthier timelines big bets demand and the rapid-fire short-term wins that get cranked out on the regular.
Use this insight to differentiate your organization from others in the space. KPIs are tactical and realistic, yet if your team achieves their KPIs, they bring you towards your key result. KPI: Daily website traffic, social media mentions, brand search volume. Example: Objective: Increase brand awareness.
Effective event correlation will differentiate between the specific cause of an event storm and the effects. Event correlation makes sense of events and contextualizes them. This is often confused with event filtering, which simply attempts to reduce the volume of events. The figure below shows a topology view of a business service.
Monitor competitor products and strategies, identifying strengths, weaknesses, and opportunities for differentiation. Miscellaneous technical skills : Some other add-on skills such as predictive analysis, A/B testing, product metrics, KPI development, and programming skills like Python are also needed.
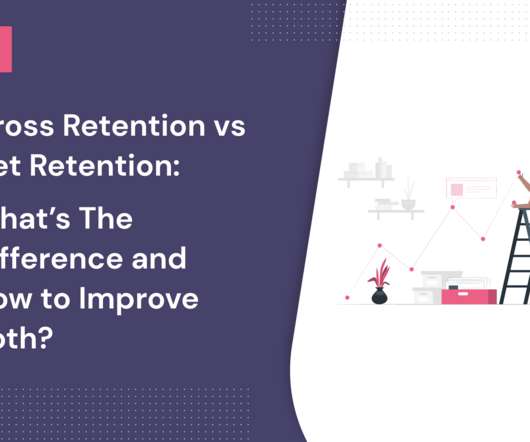
Learning to differentiate between the two can help you understand your SaaS business in greater depth and drive customer retention. You can track and see the KPI trends over time. Gross Retention vs Net Retention: which one should you measure? Short answer – there is no universal choice. Heatmaps in Hotjar. Wrapping it up.
Jason: For your customer success [34:27] _, what’s the number one goal or KPI for the company? What’s the uber KPI for the department? AO: Yeah, support needs to be the how to break fix system… AS: Critical. AO: Release type issues. Do you mind if I… CS: Go ahead. Do you have one? AO: Net retention.
Your SaaS’s Activation Rate is the percentage of users who get to that key event – and a lot of studies have found it to be that optimizing your Activation Rate has the greatest downstream impact on revenue of any KPI you should be tracking. Adjacent Users. They provide Contextual Help aimed at driving adoption and onboarding.
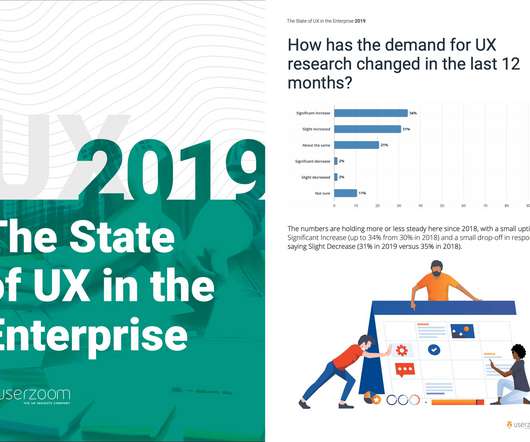
70% of CEOs now see UX and CX as a competitive differentiator, however budgets are remaining stagnant. In a startling increase from 52% last year, 70% of CEOs now talking about customer experience, user experience and the experience economy as a key differentiator in their respective markets. But what if you’re in the 30%?
This may even become a competitive differentiator. Now it’s time to start differentiating ourselves with something fresh, new, and inspiring. Sharpen your KPI skills and understand the basics of budget management in a corporate environment. UX Researcher, Professional Services. Kickstarted by the infamous Domino’s Pizza v.
We organize all of the trending information in your field so you don't have to. Join 96,000+ users and stay up to date on the latest articles your peers are reading.
You know about us, now we want to get to know you!
Let's personalize your content
Let's get even more personalized
We recognize your account from another site in our network, please click 'Send Email' below to continue with verifying your account and setting a password.


Let's personalize your content