This site uses cookies to improve your experience. To help us insure we adhere to various privacy regulations, please select your country/region of residence. If you do not select a country, we will assume you are from the United States. Select your Cookie Settings or view our Privacy Policy and Terms of Use.
Cookie Settings
Cookies and similar technologies are used on this website for proper function of the website, for tracking performance analytics and for marketing purposes. We and some of our third-party providers may use cookie data for various purposes. Please review the cookie settings below and choose your preference.
Used for the proper function of the website
Used for monitoring website traffic and interactions
Cookie Settings
Cookies and similar technologies are used on this website for proper function of the website, for tracking performance analytics and for marketing purposes. We and some of our third-party providers may use cookie data for various purposes. Please review the cookie settings below and choose your preference.
Strictly Necessary: Used for the proper function of the website
Performance/Analytics: Used for monitoring website traffic and interactions
Without effective UX analytics that goes beyond collecting data, you’re losing valuable customers. Unfortunately, the research backs this up, with a staggering 90% of users reporting that they stopped using an app due to poor performance. It covers key topics, such as: Defining UX analytics. What is UX analytics?
Think of Net Promoter Score (NPS) software as a tool to measure your customers’ feelings about your product, and categorize them based on their level of loyalty (promoters, neutrals, and detractors). The great advantage of these tools is that they streamline the creation, distribution, and analysis of NPS surveys.
While “use data to drive decision-making” sounds obvious, there’s a HUGE gap between saying it and doing it well. So, how do you get started with product analytics ? In this article, we’ll talk about: What product analytics is and why you need a solid strategy. What is product analytics?
Using a custom ChatGPT model combined with collaborative team workshops, product teams can rapidly move from initial customer insights to validated prototypes while incorporating strategic foresight and market analysis. Instead of focusing solely on today’s customer problems, product teams need to look 2-5 years into the future.
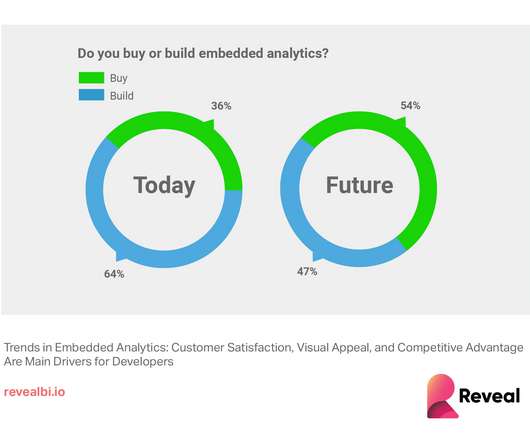
Embedding dashboards, reports and analytics in your application presents unique opportunities and poses unique challenges. We interviewed 16 experts across business intelligence, UI/UX, security and more to find out what it takes to build an application with analytics at its core.
Introduction to customer satisfaction surveys Customer satisfaction surveys are vital tools for understanding what customers think, feel, and experience. Surveys provide a range of insights, from quick feedback after a purchase to in-depth assessments of brand loyalty. Don’t worry, we’ve got you.
You can gather all the user feedback or behavioral data you want or even generate tons of Google Analyticsreports. Despite all these efforts, you’re probably still not acting on product analytics correctly. Why actionable product analytics are important. This causes siloed data and integration issues.
When your company adopts multiple SaaS solutions to drive productivity, you unknowingly create a perfect storm for data fragmentation. Your customer information lives in Salesforce, while your support tickets are in Zendesk, your product usage data in Mixpanel, and your marketing campaigns in HubSpot. Sound familiar?
Let’s review everything your customer success team has to do in the absence of any customer success tools. Collect customer data to calculate complex formulas for tracking metrics, monitor customer health scores, and resolve support tickets while continuously trying to improve retention and expansion.
Speaker: Aindra Misra, Sr. Staff Product Manager of Data & AI at BILL (Previously PM Lead at Twitter/X)
Embark on a transformation journey into the heart of the data ecosystem! This webinar is your gateway to a deeper comprehension of the foundations that drive the data industry and will equip you with the knowledge needed to navigate the evolving landscape. Delve into the diverse use cases where dataanalytics plays a pivotal role.
For example, if your brand centers around being a data-driven decision-maker, ensure that your communications emphasize this. Share case studies, write posts that highlight your analytical approach, and offer insights backed by data. Stay up-to-date with industry trends, emerging technologies, and new methodologies.
Well, it’s not quite that simple – despite the influx of customer conversations, it can be hard to derive meaningful insights from all that data. Identifying the right insights is key to operating at scale while keeping your customer experience personal, but it’s a huge challenge to find the signal in the noise.
You know your product collects tons of data. Datavisualizationtools help turn your messy spreadsheets into clear, interactive insights. The best ones dont even need SQL or data science skills. Because product analytics should be easy and accessible for everyone, not just data experts.
And not because AI itself is broken, but because companies keep treating it like a science project instead of a tool that actually needs to solve problems. Some common AI failurestories: The Data Hoarders : Companies that think collecting more data will somehow lead to an AI breakthrough. Ready to see where data is headednext?
Using the lens of a superhero narrative, he’ll uncover how AI can be the ultimate sidekick, aiding in data management and reporting, enhancing productivity, and boosting innovation. Tools and AI Gadgets 🤖 Overview of essential AI tools and practical implementation tips.
New research from Harvard Business Review AnalyticServices reveals that businesses of all sizes – from small businesses to enterprises – are realizing the business value of personal, efficient customer engagement. Below, we take a deeper dive into the report’s key data and trends. But they’re facing big barriers.
Reveal Embedded Analytics For product owners, leveraging data is not just an advantageits a necessity. Product analytics empowers you to understand gaps in your offering and how users engage with your product. Both embedded analytics and product analytics are designed to help product owners in diverse ways.
Note that Ive decided not to state the names of the tools I found, partly as the AI landscape is changing rapidly and partly as you should research and select the tools that work best in your context rather than trusting my judgment. [2] 2] Market Research AI-based tools can discover user and customer trends using predictiveanalytics.
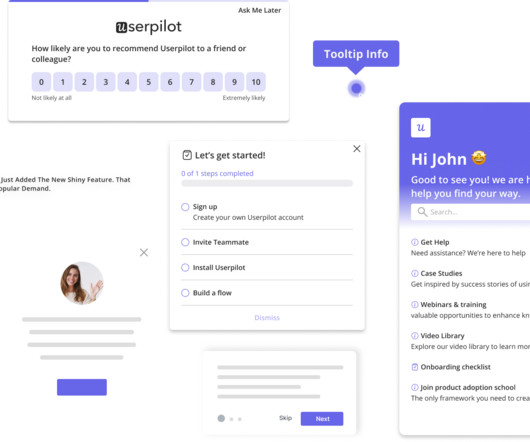
You see, although we work hard to make Userpilot the best product adoption tool on the market, we know it isnt the perfect fit for every business. Robust resource center functionalities for offering self-service help. Custom dashboards to track key metrics at a glance. for collecting user sentiment data.
Think your customers will pay more for datavisualizations in your application? But today, dashboards and visualizations have become table stakes. Discover which features will differentiate your application and maximize the ROI of your embedded analytics. Brought to you by Logi Analytics.
Drawing from his 20+ years of technology experience and extensive research, Nishant shared insights about how these activities vary across different organizational contexts – from startups to enterprises, B2B to B2C, and Agile to Waterfall environments.
Proactive Problem Solving Doug was motivated to write Proactive Problem Solving by two pieces of data showing the impact of reactive problem solving: The average manager wastes 3.5 These principles aren’t just theoretical – they’re practical tools that any product team can implement to enhance their innovation process.
TrendHunter.com is the world’s largest, most popular trend community, leveraging big data, human researchers and AI to identify consumer insights and create new opportunities for the world’s most innovative companies. 3:08] What do you do as CEO of Trend Hunter? Look at competitors for insight.
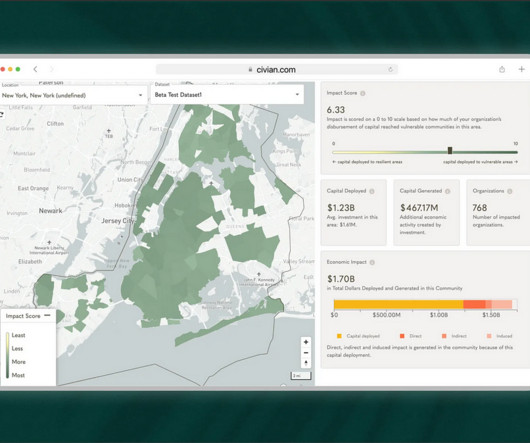
Case Study: Improving Data-Driven Decision Making for CSR Leadership Civian is a data-driven platform designed to help businesses measure, optimize, and showcase the social and economic impact of their investments in communities. Feature Engagement Users most frequently gravitated toward the map to explore and compare data.
Speaker: Dean Yao, Director of Marketing at Jinfonet
What's the next big trend in analytics software and applications? You've probably used it without even knowing: embedded reporting and analytics. They also want to provide what their users ask for: reporting and analytics from within the context of the applications they are already using.
Pro Tip: Pair your quick wins with data. A dashboard showing metrics like feature adoption or user engagement amplifies your credibility. Advanced Tactics: Stakeholder Mapping: Use tools like the Stakeholder Alignment Blueprint (available on jonihoadley.com) to identify key goals and concerns. Click here to download.
The following data and information on Business Services apps is from our 2022 Mobile App Customer Engagement Report. Brands in Business Services had varied experiences in 2021. Below is a short summary of how Business Services apps fared in 2021. Data included: Ratings and reviews. Download your copy here.
A customer expansion strategy is a playbook for increasing the revenue from your existing customers, for example, by selling them additional products and services or encouraging them to upgrade to higher plans. As your team grows and you hire new people or other departments adopt the tool, the number of seats needed increases.
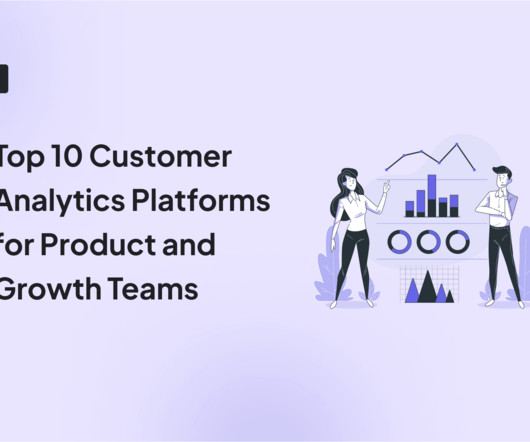
Are you struggling to make sense of scattered user data? The right customer analytics platform helps you uncover exactly how customers interact with your product: so you can spot issues early, optimize user journeys, and drive sustainable growth. Choose the best fit for your needs and transform data into actionable strategies.
Speaker: Howard Dresner, Chief Research Officer, Dresner Advisory Services, LLC
Join Howard Dresner, founder and chief research officer of Dresner Advisory Services, as he shares his research on the analytics market from surveys with over 5,000 organizations. You’ll learn about the key drivers to business success with analytics and how predictiveanalytics can drive revenue.
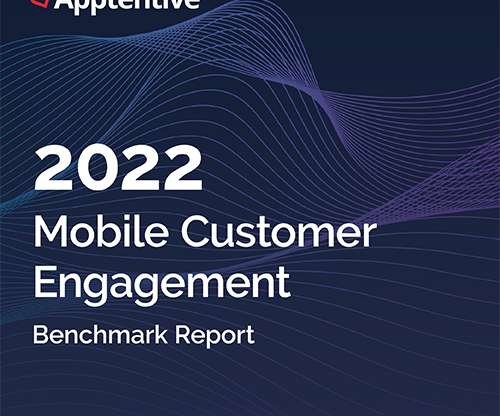
Trends that will define the year in mobile—and beyond. This report contains data from the following app categories: Finance. Personal Services. Business Services. The post Introducing: 2022 Mobile Customer Engagement Benchmark Report appeared first on Apptentive. Food and Drink. Healthcare.
Reveal Embedded AnalyticsData-driven companies have a hidden advantage! Theyve consistently outperformed their counterparts, reporting significantly higher metrics across operational efficiency (81% vs. 58%) , revenue growth (77% vs. 61%), and employee satisfaction (68% vs. 39%). How is this possible?
The following data and information on Shopping apps is from our 2022 Mobile App Customer Engagement Report. Subcategories for Personal Services Apps: Home and Family. Rather than comparing by benchmark, below is a short summary of both the Home and Family apps included in our data. Data included: Ratings and reviews.
However, without qualitative feedback and behavioral insights, teams risk misreading signals, leading to frustration and churn. User feedback is valuable , but without data, its just opinions. To eliminate these blind spots, you need to combine quantitative, qualitative, and visualdata. How to collect each data type.
Speaker: Daniel O'Sullivan, Product Designer, nCino and Jeff Hudock, Senior Product Manager, nCino
We’ve all seen the increasing industry trend of artificial intelligence and big dataanalytics. In a world of information overload, it's more important than ever to have a dashboard that provides data that's not only interesting but actually relevant and timely. Dashboard design do’s and don’ts.
The choice is tough because there’s no single tool that covers all use cases. What’s worse, you will find multiple tools in each category, making it incredibly difficult to pick the tool that satisfies your needs and offers the best value for money. Which product feedback software should you choose for your SaaS?
Today, we’re thrilled to release our 2021 Mobile App Engagement Benchmark Report. Apptentive’s annual mobile app engagement benchmark report serves as a baseline to help you understand your app’s engagement strengths and areas for improvement. Three main trends took place: massive drops, huge spikes, and higher frequency of app usage.
In 2006, British mathematician Clive Humby made the infamous statement: Data is the new oil. Like oil, raw data needs to be refined, processed and turned into something useful because its value lies in its potential. Unfortunately, most people have yet to understand what it truly means to use data. moment that makes users stick.
What happens when you build a product or service around what you think potential customers want, only for them to buy something else? It could include conducting user interviews and surveys, analyzing product usage data, and tracking customer feedback , to name a few. For starters, it shows you dont know your customers well enough.
Did you know that the embedded analytics and business intelligence market is expected to reach a $1.3 In this study, Infragistics explores the trends in modern adoption and usage of the technology. billion value in 2023?
The second big trend that I see is companies are finallyafter decades of UXers advocating for including the customer in the processstarting to recognize this is not a nice-to-have. This definition is a mouthful, so I like to visualize it. A core part of this is this visual. I can break this visual down into 11 habits.
Ulwick realized that if we could predict how customers would measure a product’s value, we could design products to meet those criteria. ” This question led to valuable insights. This framework made innovation more predictable and effective. They help team members understand how to use the data effectively.
Subcategories: Restaurant, Food Services. In our 2022 Mobile Customer Engagement Benchmark Report , a study of more than 1,000 apps across a billion mobile app installs, we take a close look at apps in the Food and Drink category. Data included: Ratings and reviews. Download the full 2022 Benchmark Report here.
Quantitative data alone doesn’t reveal intent, only outcomes. By combining contextual insights from session replays , heatmaps, and behavior analytics, user session analysis helps you interpret metrics through the lens of real user journeys. Tools can track every click and interaction.
In 2024, B2B customers expect better quality and service with streamlined experiences that match consumer-grade simplicity—no long calls or meetings required. Our B2B eCommerce TrendsReport, surveying 400+ B2B professionals in the US and Europe, reveals how eCommerce has become vital to top companies’ strategies.
We organize all of the trending information in your field so you don't have to. Join 96,000+ users and stay up to date on the latest articles your peers are reading.
You know about us, now we want to get to know you!
Let's personalize your content
Let's get even more personalized
We recognize your account from another site in our network, please click 'Send Email' below to continue with verifying your account and setting a password.


Let's personalize your content