This site uses cookies to improve your experience. To help us insure we adhere to various privacy regulations, please select your country/region of residence. If you do not select a country, we will assume you are from the United States. Select your Cookie Settings or view our Privacy Policy and Terms of Use.
Cookie Settings
Cookies and similar technologies are used on this website for proper function of the website, for tracking performance analytics and for marketing purposes. We and some of our third-party providers may use cookie data for various purposes. Please review the cookie settings below and choose your preference.
Used for the proper function of the website
Used for monitoring website traffic and interactions
Cookie Settings
Cookies and similar technologies are used on this website for proper function of the website, for tracking performance analytics and for marketing purposes. We and some of our third-party providers may use cookie data for various purposes. Please review the cookie settings below and choose your preference.
Strictly Necessary: Used for the proper function of the website
Performance/Analytics: Used for monitoring website traffic and interactions
Think of Net Promoter Score (NPS) software as a tool to measure your customers’ feelings about your product, and categorize them based on their level of loyalty (promoters, neutrals, and detractors). The great advantage of these tools is that they streamline the creation, distribution, and analysis of NPS surveys.
A custom ChatGPT model that helps accelerate product innovation Watch on YouTube TLDR In this episode, I interview Mike Hyzy, Senior Principal Consultant at Daugherty Business Solutions. He explains how to conduct an AI-powered design sprint that transforms product concepts into clickable prototypes in just hours instead of weeks.
How product managers can adapt core responsibilities across different organizations and contexts Watch on YouTube TLDR Through his research and practical experience at MasterCard, Nishant Parikh identified 19 key activities that define the role of software product managers. Why study the 19 key activities of software product managers?
Without effective UX analytics that goes beyond collecting data, you’re losing valuable customers. Unfortunately, the research backs this up, with a staggering 90% of users reporting that they stopped using an app due to poor performance. It covers key topics, such as: Defining UX analytics.
Think your customers will pay more for datavisualizations in your application? But today, dashboards and visualizations have become table stakes. Discover which features will differentiate your application and maximize the ROI of your embedded analytics. Brought to you by Logi Analytics.
hours daily fixing problems, with 75% of issues stemming from broken systems rather than employee mistakes. Even more concerning, products typically lose 50% of their innovative value during development as unique ideas get compromised to fit existing systems. Doug shared that the average manager wastes 3.5
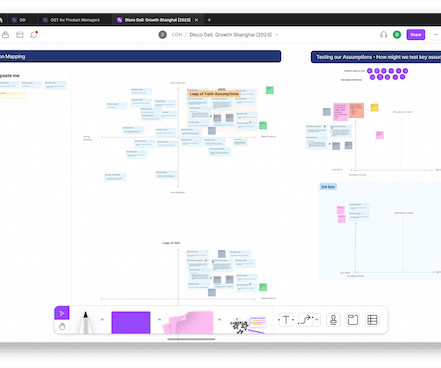
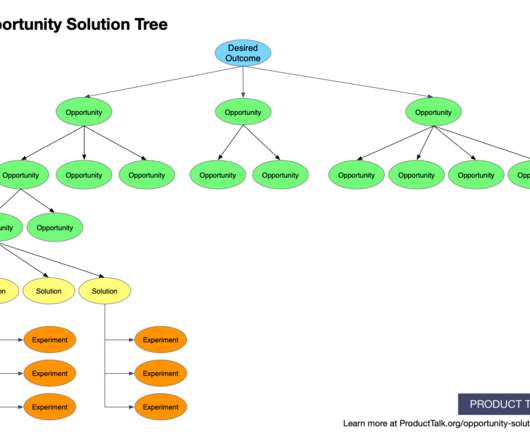
The opportunity solution tree helps visualize all the work that goes into continuous discovery. And while opportunity solution trees have become increasingly common among product teams, there’s still plenty of room for customization, both in the way you set up your trees and the tools you use to build them.
With so many options available, how do you choose the right session recording software for your team? We’ve researched, tested, and curated a list of 10 top-rated session recording tools to help you unlock valuable user insights and build better digital experiences.
How AI captures customer needs that human product managers miss Watch on YouTube TLDR In my recent conversation with Carmel Dibner from Applied Marketing Science, we explored how artificial intelligence is transforming Voice of the Customer (VOC) research for product teams.
An interactive guide filled with the tools to turn your data into a competitive advantage. They rely on data to power products, business insights, and marketing strategy. This playbook contains: Exclusive statistics, research, and insights into how the pandemic has affected businesses over the last 18 months.
This approach has informed her success across different industries and roles, from retail to technology. Anya’s development of Taelor offers valuable lessons in how to validate and expand upon initial product insights. Through market research, she discovered her ideal customers weren’t whom she initially expected.
What happens when you build a product or service around what you think potential customers want, only for them to buy something else? According to Harvard Business Review, 80% of new products fail, primarily because companies fail to conduct proper customer research. The solution seems obvious: improve your customer research process.
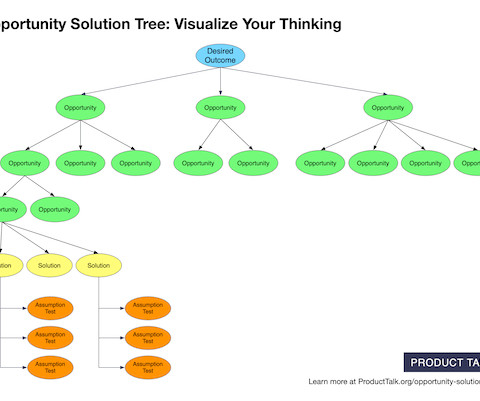
Opportunity solution trees help product teams chart the best path to their desired outcome. Opportunity solution trees help product teams chart the best path to their desired outcome. – Tweet This In this article, we’ll cover what an opportunity solution tree is, the benefits of using one, how to create one, and so much more.
We covered how to manage messy opportunity solution trees , the most common challenges teams face when getting started with the discovery habits, what Im working on next, and so much more. I started my career as a software engineer. How are we building production-quality software? I think that was in 2004. What does that mean?
The objective is to receive feedback and prioritize it internally against (1) company objectives (2)customer pains/experience (3) Quarterly Product OKRs and ship out solutions. . A feedback loop is: part of a system in which some portion (or all) of the system’s output is used as input for future operations. Get Insights.
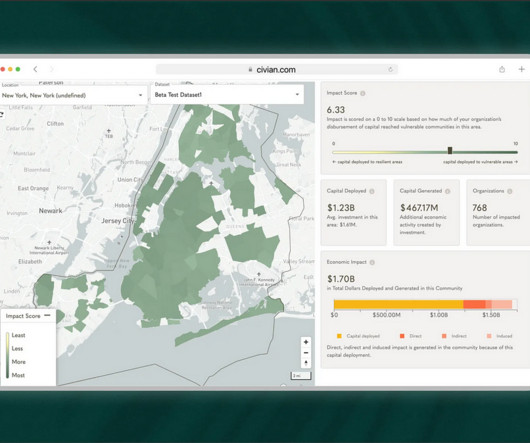
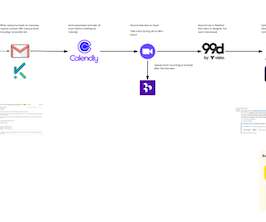
Case Study: Improving Data-Driven Decision Making for CSR Leadership Civian is a data-driven platform designed to help businesses measure, optimize, and showcase the social and economic impact of their investments in communities. Our Process To make our interviews more fruitful, we established specific research objectives.
Which product feedback software should you choose for your SaaS? The choice is tough because there’s no single tool that covers all use cases. What’s worse, you will find multiple tools in each category, making it incredibly difficult to pick the tool that satisfies your needs and offers the best value for money.
Similarly, the opportunity solution tree can be an incredibly powerful tool for keeping track of your desired outcome , the opportunities you learn about during discovery, the solutions you’re considering for each opportunity, and the experiments you’ll run to assess your ideas. Tweet This.
Unfortunately, “If you build it, they will come” does not hold true when it comes to the mobile app launch. This famous line from Field of Dreams is all too representative of how many app publishers face the ‘inessentiality’ of mobile marketing. They focus all of their time and resources on building a great app. It’s marketing.
If there is one thing thats altering the way we create user experience (UX) designs and conduct research in 2024, it is definitely artificial intelligence (AI). From new UX-related technologies and automation to personalization. From new UX-related technologies and automation to personalization. No one can denythat.
Maybe you’ve even tried some popular AI tools, like the good ol’ ChatGPT. But did you know that certain AI tools work best at specific phases of the design process? Having tested a selection of AI design tools, I’ve found that some are better suited for certain stages of the UX design process than others.
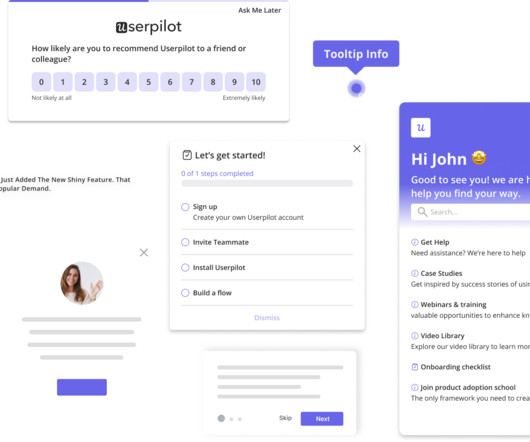
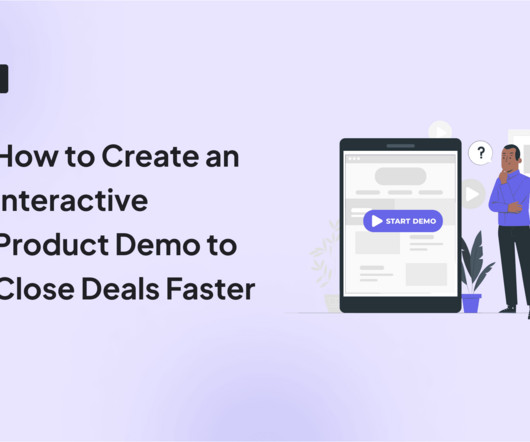
An interactive demo is a self-guided walkthrough that uses tooltips, modals, hotspots, and other interactive elements to help users quickly explore your SaaS product. Why build interactive demos for your SaaS product? What is an interactive product demo? This results in faster Aha!
User experience can make or break a web app. If your software is slow or buggy, users wont stick around for long. Thats where real user monitoring tools come inthey provide real-time insights into how users engage with the app , helping you detect performance issues before they impact your bottom line.
Customer intelligence (CI) data and insights are instrumental in product management. However, with so many customer intelligence tools available, how do you select the right one? If you’re in two minds about which customer intelligence software to use, we’ve got you covered. Book a demo now to see it in action.
How product managers can use AI to work more efficiently Watch on YouTube [link] TLDR AI is changing how we manage products and come up with new ideas, giving us new tools to work faster and be more creative. AI can help in many parts of making a product, from research to writing product plans and documents.
SaaStools are the industry's biggest open secret. Wondering what type of tools you should have in your stack? Then read on to discover the top 20 cloud-based apps that will help streamline different parts of your business. TL;DR SaaStools are applications that users can access through an internet connection.
When it comes to continuous discovery , there’s no such thing as “the perfect tool.” Instead of seeking the best tool out there, it’s much more effective to look for the best tool for your team. Teresa often says, “The best tool is the one that your team will use.” Today, we’re taking a slightly different approach.
As investment in digital transformation continues, mobile apps have become a primary channel of communication with customers. With customers spending more time and money on mobile apps, it is important that companies continue to adapt and prioritize mobile in their customer feedback solution. percent increase from 2021.
No product tool or template can save you if you’re not killing it in these three areas. That’s why we’ve listed 12 tools that the best product managers use to do their jobs better? and not the best product management tools. Product managers (PMs) are ninjas of aligning people, management, and processes.
Unfortunately, that technology isn’t here yet, so UX researchtools are the next best thing. These tools can provide you with the qualitative and quantitative data you need to understand how your customer behaves in your product, so you can make the necessary changes to improve their experience.
Visualizing discovery work with an opportunity solution tree has been a game-changer for both me and the teams that I work with. It’s a simple visual that packs a lot of power. From there, an effective team is doing two key research activities week over week. Assumption testing is evaluative. We need both.
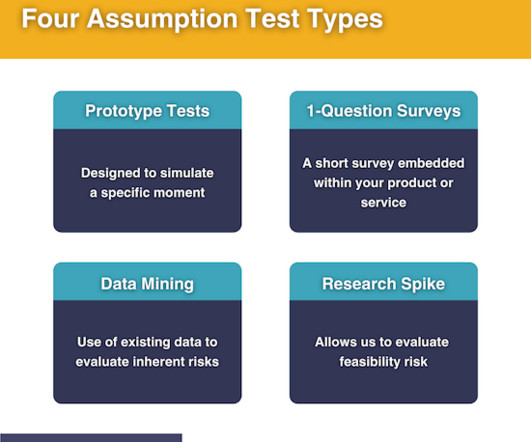
A regular cadence of assumption testing helps product teams quickly determine which ideas will work and which ones won’t. And sadly, most product teams don’t do any assumption testing at all. In this article, I’ll cover assumption testing from beginning to end, including: Why should product teams test their assumptions?
Taylor Swiftimage via Wikipedia Commons Im a big fan ofuser research. I like testing things withusers. I love gathering data, analysing it and using it to justify design decisions. To paraphrase Taylor Swift: me and research vibe likethat. But not everyone vibes with user research. And what you can do aboutit.
That’s where customer engagement software comes in. The right platform will equip you with the tools to interact effectively, gather valuable feedback, and build lasting customer relationships. Integrations with other tools: Does it integrate with CRM, marketing automation, and other essential business applications?
Using software for product management. This article will examine some of the best product management software in the market. TL;DR Choose a product management platform with advanced features, a user-friendly interface, customization, third-party integrations, scalable pricing, robust security , and collaboration features.
Manual testing of your mobile products is important and useful. Automated testing really assists with the efficiency here; being able to execute the same tests repeatedly, quickly and timely on a multitude of devices. What is Mobile Test Automation? Why do Mobile Test Automation? an app or website.
Tali Melchior , Director of Product Management at Texthelp , was first inspired to experiment with opportunity solution trees in a previous role. Then when Tali moved to her current position, she brought her opportunity solution tree knowledge along and adapted it to the new setting. It was a great experience,” says Tali.
Why market research is product managers’ secret ingredient for successful products Watch on YouTube TLDR Market research is a key part of product development and management. In this episode, Chip Chonym explains why market research matters throughout the innovation process, discussing both qualitative and quantitative methods.
How AI captures customer needs that human product managers miss Watch on YouTube TLDR In my recent conversation with Carmel Dibner from Applied Marketing Science, we explored how artificial intelligence is transforming Voice of the Customer (VOC) research for product teams.
Wondering what tools you should have in your PLG tech stack to guarantee business success? Successful SaaS companies don’t rely on a single tool doing all the work to drive product-led growth but a multitude of tools specializing in different tasks simultaneously. Ready to execute your PLG strategy?
Welcome to Product PickEm 2025 , where the best emerging product tool startups go head-to-head in a bracket-style competition, and YOU decide which ones rise to the top via our LinkedIn polls on the Productside page. Each round, the lowest-scoring tools get eliminated, and the best move forward. Forget the hype. Four winners.
Are you on the lookout for tools that can help you improve customer retention ? There are quite a few solutions around, so it might be difficult to find, especially as we’re not talking about one specific set of tools but rather a whole range of different solutions covering a range of use cases.
10 rules of design plus 10 useful AI tools for ensuring success in a complexproject Design by Outcrowd SaaS design goes beyond standard web design. SaaS UX/UI design aims to capture and retain users, teach them how to use the product, simplify complex processes, and create competitive advantages.
Laura and her team spend every working hour researching, designing, and experimenting with ways to measure and improve team velocity (while avoiding burnout). Her background is in developer tools and distributed systems. I’ve yet to come across a software leader who isn’t.
We organize all of the trending information in your field so you don't have to. Join 96,000+ users and stay up to date on the latest articles your peers are reading.
You know about us, now we want to get to know you!
Let's personalize your content
Let's get even more personalized
We recognize your account from another site in our network, please click 'Send Email' below to continue with verifying your account and setting a password.


Let's personalize your content