This site uses cookies to improve your experience. To help us insure we adhere to various privacy regulations, please select your country/region of residence. If you do not select a country, we will assume you are from the United States. Select your Cookie Settings or view our Privacy Policy and Terms of Use.
Cookie Settings
Cookies and similar technologies are used on this website for proper function of the website, for tracking performance analytics and for marketing purposes. We and some of our third-party providers may use cookie data for various purposes. Please review the cookie settings below and choose your preference.
Used for the proper function of the website
Used for monitoring website traffic and interactions
Cookie Settings
Cookies and similar technologies are used on this website for proper function of the website, for tracking performance analytics and for marketing purposes. We and some of our third-party providers may use cookie data for various purposes. Please review the cookie settings below and choose your preference.
Strictly Necessary: Used for the proper function of the website
Performance/Analytics: Used for monitoring website traffic and interactions
Without effective UX analytics that goes beyond collecting data, you’re losing valuable customers. Unfortunately, the research backs this up, with a staggering 90% of usersreporting that they stopped using an app due to poor performance. Basically, anything that ruins the userexperience.
Using a custom ChatGPT model combined with collaborative team workshops, product teams can rapidly move from initial customer insights to validated prototypes while incorporating strategic foresight and market analysis. Instead of focusing solely on today’s customer problems, product teams need to look 2-5 years into the future.
Drawing from his 20+ years of technology experience and extensive research, Nishant shared insights about how these activities vary across different organizational contexts – from startups to enterprises, B2B to B2C, and Agile to Waterfall environments.
As you might know, session replay tools track every click, scroll, and hiccup from your usersjust as if you were watching through their eyes. They allow you to close the gap between your analyticsdata and the feedback you get from users. But with so many session replay tools, which ones are worth your time and money?
Are you looking for a session replay tool but not sure if Fullstory is the right option for your SaaS? The tool’s pros and cons. Understand drop-off points within user funnels to optimize conversion rates. Pinpoint bug locations by linking user sessions to bug reports or customer tickets. Fullstory pricing.
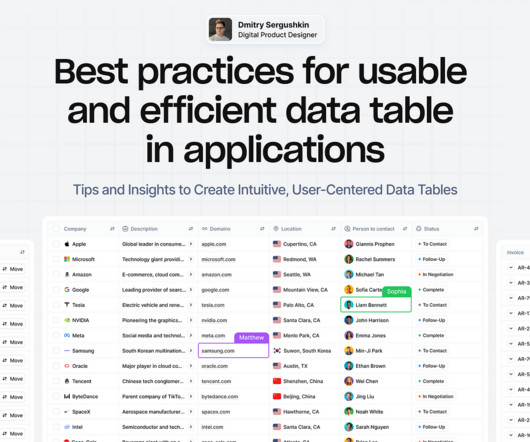
Tips and Insights to Create Intuitive, User-Centered DataTables Data tables provide a structured way to organize and manage information, making it easier to analyze and visualizedata effectively. Well-designed tables enable users to access, analyze, and act on critical information quickly and accurately.
Note that Ive decided not to state the names of the tools I found, partly as the AI landscape is changing rapidly and partly as you should research and select the tools that work best in your context rather than trusting my judgment. [2] 2] Market Research AI-based tools can discover user and customer trends using predictiveanalytics.
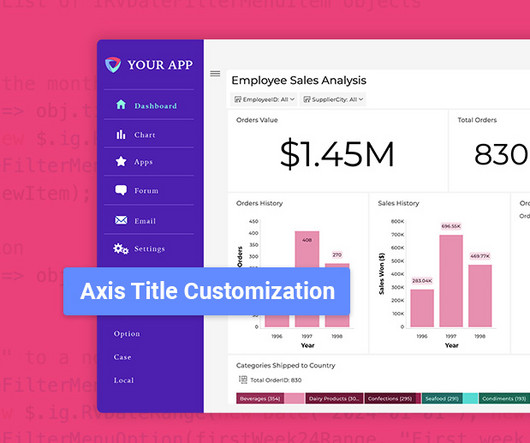
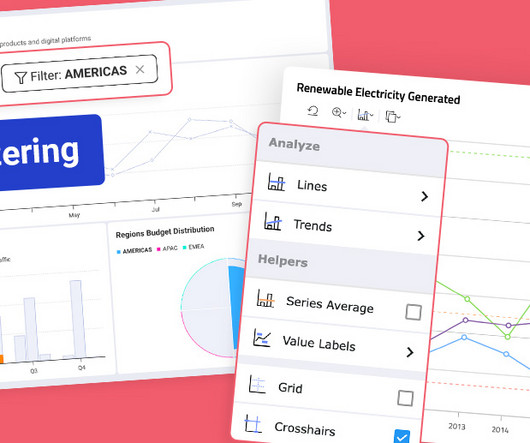
Reveal Embedded Analytics This update is packed with customization, usability, and performance improvements to help you build seamless, high-impact analyticsexperiences faster. Fixed Lines for Charts: Set static reference points to highlight key data trends.
If you’re shopping around for a mobile app analytics platform before biting the bullet with Fullstory, you’ve landed in the right place. FullStory is a robust web and analyticstool but there are platforms out there that may specialize in one of the features you want. Best for AI-powered future outcomes predictions.
The choice is tough because there’s no single tool that covers all use cases. What’s worse, you will find multiple tools in each category, making it incredibly difficult to pick the tool that satisfies your needs and offers the best value for money. Which product feedback software should you choose for your SaaS?
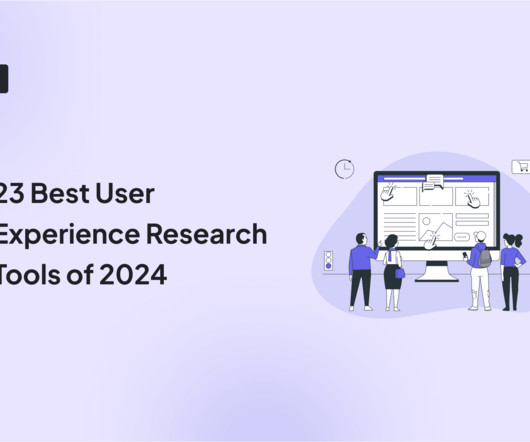
Unfortunately, that technology isn’t here yet, so UX research tools are the next best thing. These tools can provide you with the qualitative and quantitative data you need to understand how your customer behaves in your product, so you can make the necessary changes to improve their experience.
If there is one thing thats altering the way we create userexperience (UX) designs and conduct research in 2024, it is definitely artificial intelligence (AI). Well start with an overview and explore how AI can take on tasks such as analyzing userdata and automated prototyping to help professionals connect with users on a humanlevel.
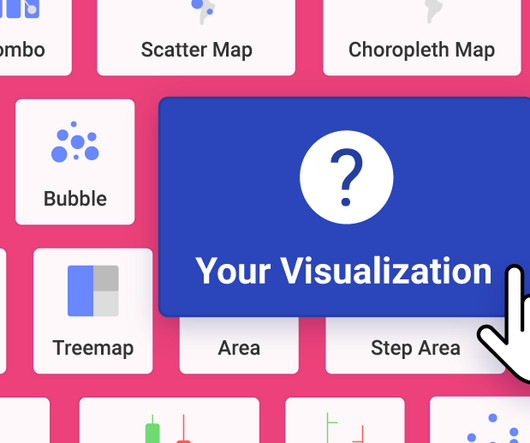
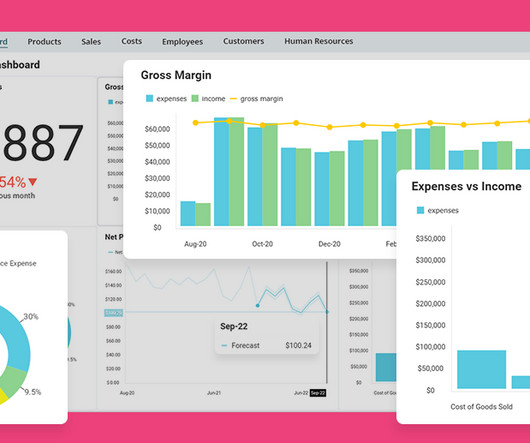
Reveal Embedded Analytics We live in an era where data shapes decisions across industries. While datavisualizations have become essential, not all standard visualizations cater to specialized reporting needs. Dive in to discover its unmatched benefits and how you can craft unique reports effortlessly.
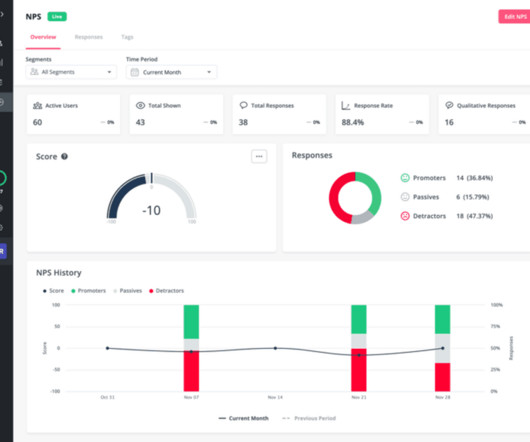
A customer sentiment dashboard is a great way to visualize customer feedback and see what users love (or hate) about your product. But how do you collect the right data for your analysis? This article shows you a step-by-step process and some of the best tools to use. However, a single data source (e.g.,
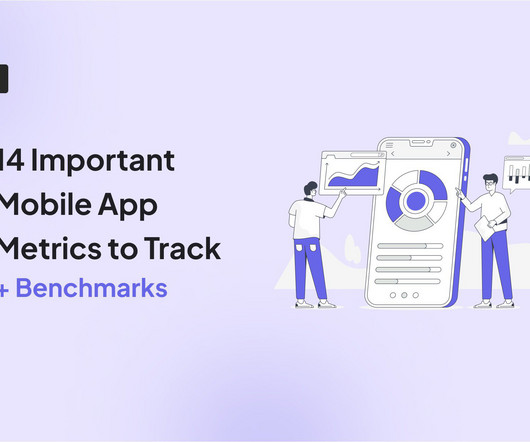
The key is to understand your users and continuously optimize your mobile app for exceptional value. Overview: Mobile app analytics metrics Below is a quick summary of the mobile metrics every PM should be tracking. 1 Engagement DAU/MAU Understand daily and monthly active user engagement and overall app popularity.
Analyticstools offer a competitive advantage for companies investing in prolonged product growth. However, not all companies can invest precious resources in an analyticstool. In reality, some companies are better served using free vs paid analytics platforms. There are different types of analyticstools.
Want to conduct customer journey visualization but not sure what’s the best way to do it? This article shows you a step-by-step process for collecting customer data and creating easy-to-understand visual maps. TL;DR A customer journey map represents the steps users take when interacting with your brand.
But with so many tools in the market, which one should you choose for product analytics ? TL;DR Funnel tracking lets you track user activities across various user journeys. Unlike sales funnel software, funnel-tracking tools track numerous funnels such as goal completion, conversion , and review funnels.
We live and work today in a world that is increasingly data-driven, but we cannot successfully adopt a data-driven approach to decision making without first identifying the metrics that matter most. Plus, there’s no shortage of tools to help us quantify seemingly everything. The real issue is lack of focus. In This Article.
This blog references our new e-guide, titled The Complete Guide to CX Transformation . Surveys, combined with open text analysis, however, hold immense potential for uncovering deeper customer insights from customer feedback. Use these questions liberally to uncover richer insights. How can we improve the userexperience?
Reveal Embedded Analytics Introduction to Embedded Analytics in Angular and.NET Core Embedded analytics is no longer an optional featureits a necessity for modern applications. In 2025, users demand seamless access to real-time insights directly within the tools they use daily.
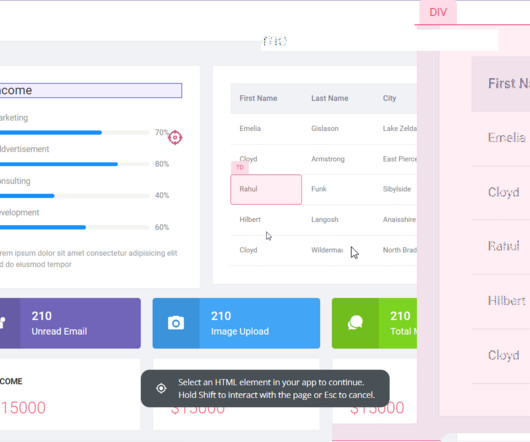
Understanding how end-users interact with your product is crucial to identifying userexperience bottlenecks. It also helps identify better ways to engage users. When combined with product analytics , end-user behavior monitoring can help you boost product usage and retention rates.
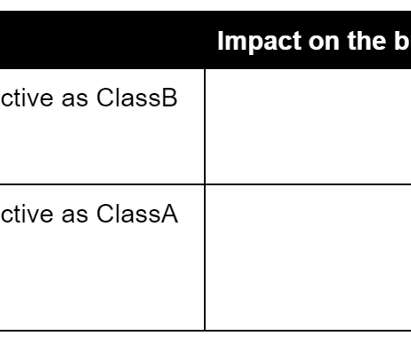
Reveal Embedded Analytics Embedded analytics platforms have gained popularity as businesses seek to leverage data for decision-making and gain a competitive edge. One of these features you should look for is dashboard linking. What Is Dashboard Linking? However, not all solutions are the same.
Reveal Embedded Analytics Embedded analytics platforms have gained popularity as businesses seek to leverage data for decision-making and gain a competitive edge. One of these features you should look for is dashboard linking. What Is Dashboard Linking? However, not all solutions are the same.
The “shiny penny” approach (focus all your attention on the hottest tools in the market) or “head in the sand” approach (fall victim to analysis paralysis and avoid choosing any tools) are no longer viable. But here’s the thing: a tool is not a strategy. The anatomy of a marketing tech stack [with recommended tools].
Make better-informed business decisions Data-driven insights from CX metrics enable teams to make informed decisions. Understanding your current customer experience helps prioritize the right things that matter to your customers. This applies to product development, marketing strategies, and customer service enhancements.
Want to know how you can use survey analytics to leverage customer feedback data? Survey analytics is the process of interpreting survey responses to get valuable insights. So let’s see how you can collect customer feedback for analysis and understand user sentiment to improve the userexperience.
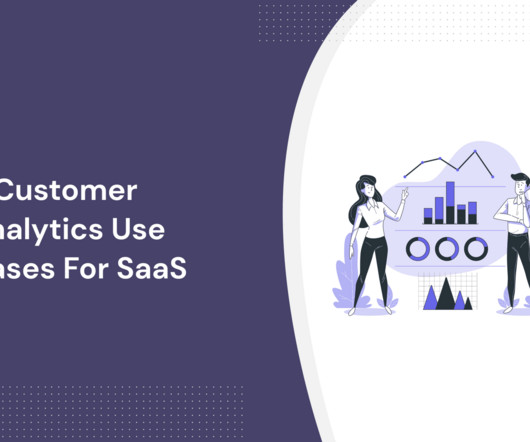
Looking for customer analytics use cases that can significantly improve your SaaS? We also cover: Customer analytics categories. The three types of customer analytics and their significance. How to measure customer behavior with dataanalytics. There are four categories of customer analytics categories.
Knowing how well your products and campaigns perform can give you the most vital insights needed to guide your business. Having the right performance reporting solution for product analytics in your arsenal optimizes risk management and aids in financial planning by ensuring each decision you make is data-driven.
The article here focusses on business criterion to use to better evaluate if a predictive model is ready for production and the associated risk when the predictions are wrong. Optimized for better outcomes Today, businesses regularly use predictiveanalytics to optimize their business and achieve better business outcomes.
When it comes to boosting your product growth, user tracking tools can make your life a lot easier. They offer insights into product performance , what your users are doing inside your product, and why they are doing it. But how do you know you’re picking the right tools? What is user tracking?
Customer insights provide intelligence and analysis about customer experience, activities, and preferences. That said, let’s go over what type of data you can collect and explore some customer insights examples you can learn from.
Do you desire a loyal fanbase that can’t get enough of your product or service? The solution might lie in your ability to create a comprehensive userexperience map. A well-crafted userexperience map can be your secret weapon for understanding customers, identifying pain points, and boosting product engagement.
Todays Fintech disruptors and neobanks are igniting our brains reward centers with flashy visuals, gamified challenges and social interactivity that practically beg us to keep coming back for more. It ultimately changes how we think about financial services. Today, clients expect more than a basic straightforward financial service.
Having funnel analysis tools that provide comprehensive analyticalinsights about where and why users drop off will solidify your business’s competitiveness in the long term. TL;DR Funnel analyticsrefers to the analysis of events across all stages of every customer journey. Starts at $20/month).
Alongside usability testing, userexperience interface guidelines allow you to build more intuitive and user-friendly solutions. In this blog, we explain eleven userexperience and interaction design guidelines supported by real-life examples to improve product engagement. System status visibility.
In this discussion we address what it means to properly incorporate UX (userexperience) into your product work. This is deeply understanding the userexperience that creates greater value, beating competitors and delighting customers. 1:37] Why should UX (userexperience) be part of product strategy?
Inclusive by Design: Transform Your UI/UX from Good to Great In todays digital landscape, ensuring accessibility is no longer optionalit is a critical aspect of designing user interfaces (UI) and userexperiences (UX). Some key disabilities to account forinclude: Visual impairments : Color blindness, low vision, or blindness.
Hotjar has long been a go-to tool for understanding user behavior, but its not the only player in the game. Whether youre looking for easy-to-use Hotjar alternatives with advanced product analytics and a better pricing structure, we are here to help! In fact, it has been struggling to keep up with others for a while.
How do you leverage product analytics marketing automation to boost customer acquisition, retention, and account expansion? TL;DR Product analytics marketing automation involves using product analytics to track product usage and customer behavior to develop automated marketing experiences.
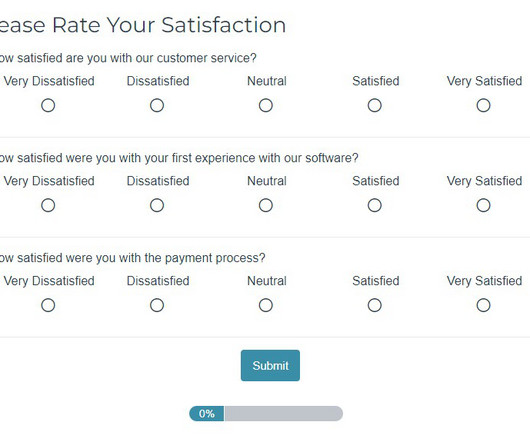
Customer satisfaction analytics are key to understanding what makes your customers happy and building a product that retains users. But how can you leverage this user sentiment data to lead product development and grow your business? Picking the right type of survey that aligns with the type of data you need to collect.
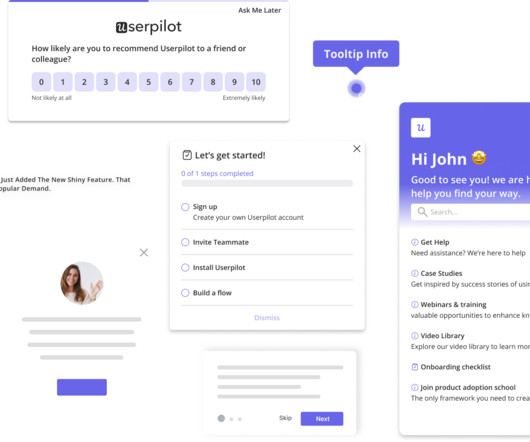
Funnel reports are a popular analyticstool used to optimize customer journeys and user flows. Our guide explains how to build and analyze funnel reports for actionable insights. To create funnel reports in Userpilot , you first need to define the conversion events. Let’s get to it!
We recently released more than 20 new features that make Intercom better at handling complex queries and therefore a better tool for offering world-class support at scale. The process usually looks like this: You have a problem with a product or service that needs resolving. Intercom’s ticketing workflow: Messenger + Inbox + Reporting.
Reveal Embedded Analytics What’s New in Reveal 1.6.7? New Toolbar [Beta] One of the standout features of this release is the introduction of the new toolbar. This updated toolbar enhances userexperience by offering advanced data analysis and interactive features. For details, please refer to our release notes.
We organize all of the trending information in your field so you don't have to. Join 96,000+ users and stay up to date on the latest articles your peers are reading.
You know about us, now we want to get to know you!
Let's personalize your content
Let's get even more personalized
We recognize your account from another site in our network, please click 'Send Email' below to continue with verifying your account and setting a password.


Let's personalize your content