article thumbnail

10 Analytics Dashboard Examples to Gain Data Insights for SaaS [+Best Tools]

Userpilot

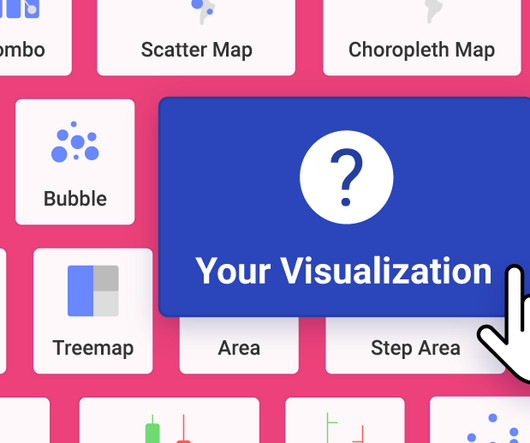
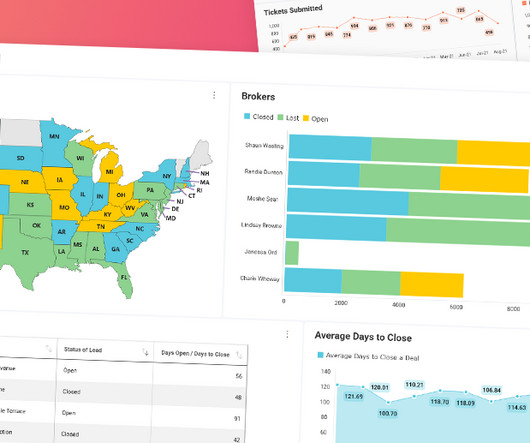
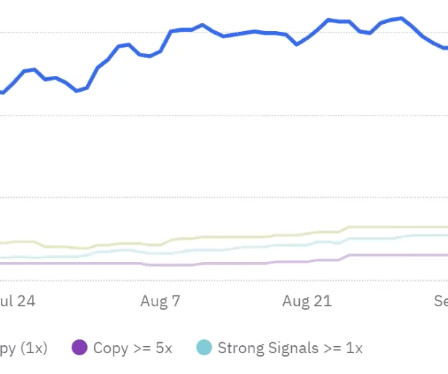
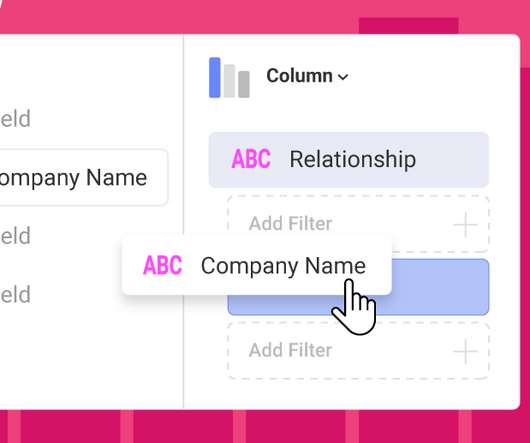
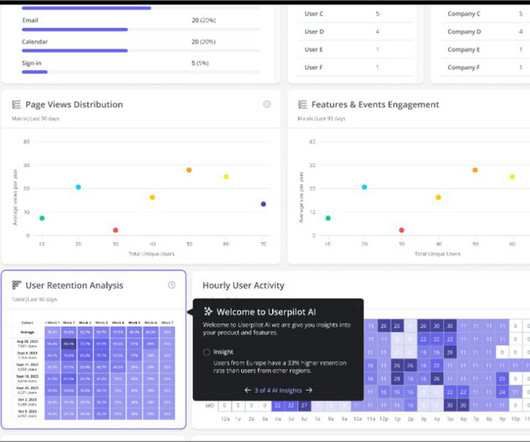
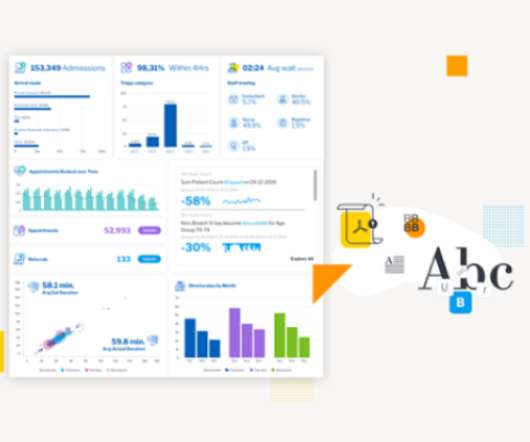
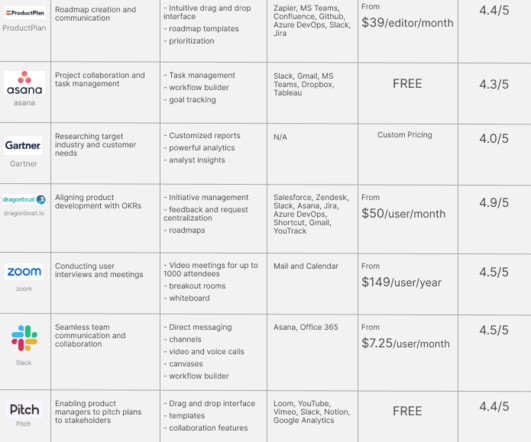
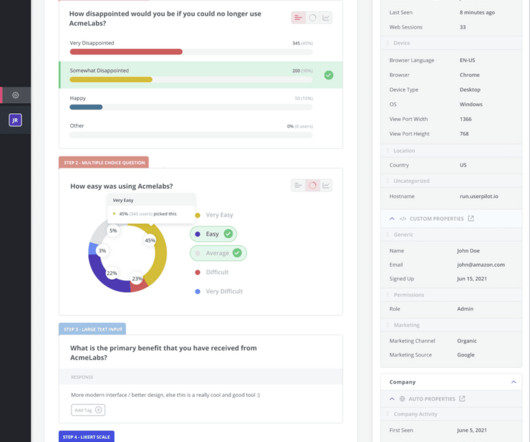
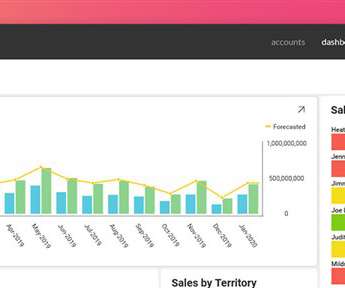
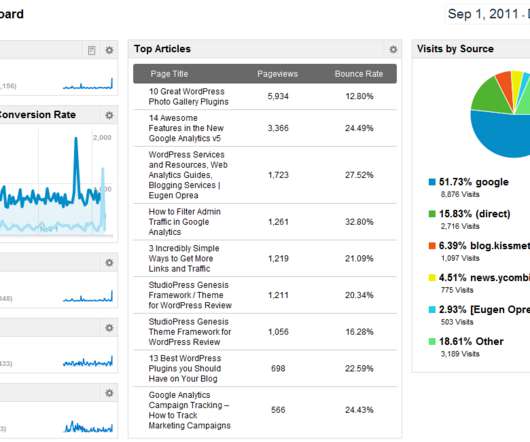
Are you tracking SaaS metrics without knowing how to make the analytics process easier? Analytics dashboards are visualization tools that give you an overview of key metrics. This makes it much easier to extract insights from your analysis compared to looking at mere numbers. Book a demo to learn more.

article thumbnail

DIY Data Visualizations: Provide Unique Insights of Your Data with Reveal BI 

Reveal

Reveal Embedded Analytics We live in an era where data shapes decisions across industries. While data visualizations have become essential, not all standard visualizations cater to specialized reporting needs. Dive in to discover its unmatched benefits and how you can craft unique reports effortlessly.

Insiders

Sign Up for our Newsletter

This site is protected by reCAPTCHA and the Google Privacy Policy and Terms of Service apply.

article thumbnail

Free vs Paid Analytics Platforms: How to Choose One (+ Best Tools in Each Category)

Userpilot

Analytics tools offer a competitive advantage for companies investing in prolonged product growth. However, not all companies can invest precious resources in an analytics tool. In reality, some companies are better served using free vs paid analytics platforms. There are different types of analytics tools.

article thumbnail

14 Best Customer Analytics Platforms in 2024

Userpilot

As you’re researching customer analytics platforms, you’ve probably noticed how hard it is to find reliable information on the available solutions. TL;DR Customer analytics platforms are specialized tools that allow you to collect and analyze data. Starts with Einsten Predictions’ $75/month billed annually.)

article thumbnail

The Essential Guide to Analytic Applications

Embedding dashboards, reports and analytics in your application presents unique opportunities and poses unique challenges. We interviewed 16 experts across business intelligence, UI/UX, security and more to find out what it takes to build an application with analytics at its core.

article thumbnail

Heap vs Google Analytics: Which Analytics Tool Is Better?

Userpilot

Heap and Google Analytics are popular product analytics tools that help businesses pursue product growth with data-driven insights. In this article, we’ll go through the main differences between both tools to help you understand which one is better for you. respectively. What is Heap?

article thumbnail

How to influence with data and insights?

Piyanka Jain

Data can be a powerful tool if you know how to put it to work! Often I start my analytics conference keynote addresses by asking the audience to share the issues they face in their organizations. In fact, this issue is so pervasive in organizations that 80 to 90% of the analysts in the audience report this problem.

article thumbnail

Embedded Analytics Insights for 2024

Organizations look to embedded analytics to provide greater self-service for users, introduce AI capabilities, offer better insight into data, and provide customizable dashboards that present data in a visually pleasing, easy-to-access format.

article thumbnail

Embedded Analytics, Everywhere

Speaker: Dean Yao, Director of Marketing at Jinfonet

What's the next big trend in analytics software and applications? You've probably used it without even knowing: embedded reporting and analytics. Software development teams more often now are embedding 3rd party analytics solutions into their products and applications to let them focus on other core areas of their software.

article thumbnail

How to Democratize Data Across Your Organization Using a Semantic Layer

Speaker: speakers from Verizon, Snowflake, Affinity Federal Credit Union, EverQuote, and AtScale

Join this webinar panel for practical advice on how to build and foster a data literate, self-service analysis culture at scale using a semantic layer. In this webinar you will learn about: Making data accessible to everyone in your organization with their favorite tools.

article thumbnail

Analytics Best Practices: 5 Key Dashboard Design Principles

In this blog, we explore 5 key principles that exist to ensure you create a relevant dashboard that guides and simplifies the user experience, makes it as easy as possible to interpret what is presented no matter its complexity, and increases the adoption of BI.

article thumbnail

UX and Design Tips for Better Dashboards: Product Manager Laura Klein Explains How to Improve Your Analytics

Speaker: Laura Klein, Principal at Users Know and Author of UX for Lean Startups

That's why Laura Klein, product manager and UX designer, has a set of tips to help application teams improve their embedded dashboards and reports. How to avoid common mistakes people make when presenting data. And yet we have so many of them in our lives. October 25, 2018 12:30 PM PST, 3:30 PM EST, 8:30 PM GMT

article thumbnail

How to Use Data to Build Strong Customer Communities

Speaker: Carrie Melissa Jones Founder, Gather Community Consulting

They can use insights, advice, and qualitative data about community members to build successful, promising communities. Register to get practical advice on how to: Present a case for why research matters to various parts of your organization. Make sure you don’t miss out on this incredibly insightful webinar!

article thumbnail

All Method, No Madness: Guiding Agile Teams Through Research

Speaker: Amanda Stockwell, President of Stockwell Strategy

However, if you're willing to adapt the right way, you don't have to sacrifice agility or user insights. Using the right strategy, your agile team will collect qualitative data, interpret it, and integrate it effectively. Data analysis and integration. In this webinar, she'll make specific suggestions around: Team makeup.

article thumbnail

Get S.M.A.R.T. with your Roadmap

Speaker: Miles Robinson, Technical Project Manager, iFixIt

How to frame the data to help make that decision can be done by instinct, or it can be done SMART: Specific definition of the project scope and completion. Each of the tools can be used in isolation or together, and they all help to bring clarity and structure to the data you will need to make the best use of your time, money and people.