This site uses cookies to improve your experience. To help us insure we adhere to various privacy regulations, please select your country/region of residence. If you do not select a country, we will assume you are from the United States. Select your Cookie Settings or view our Privacy Policy and Terms of Use.
Cookie Settings
Cookies and similar technologies are used on this website for proper function of the website, for tracking performance analytics and for marketing purposes. We and some of our third-party providers may use cookie data for various purposes. Please review the cookie settings below and choose your preference.
Used for the proper function of the website
Used for monitoring website traffic and interactions
Cookie Settings
Cookies and similar technologies are used on this website for proper function of the website, for tracking performance analytics and for marketing purposes. We and some of our third-party providers may use cookie data for various purposes. Please review the cookie settings below and choose your preference.
Strictly Necessary: Used for the proper function of the website
Performance/Analytics: Used for monitoring website traffic and interactions
Featuring an engaging discussion with Inis Hormann (Marketing Director Germany, Cepheid) and Steve Kury (Leadership Development Consultant, SHK Leadership Consulting), the session provided actionable insights for PMs at every level. Leverage Data: Use findings to guide decisions, reduce uncertainty, and inform future product iterations.
Introduction to customer satisfaction surveys Customer satisfaction surveys are vital tools for understanding what customers think, feel, and experience. Surveys provide a range of insights, from quick feedback after a purchase to in-depth assessments of brand loyalty. Don’t worry, we’ve got you.
Using a custom ChatGPT model combined with collaborative team workshops, product teams can rapidly move from initial customer insights to validated prototypes while incorporating strategic foresight and market analysis. Instead of focusing solely on today’s customer problems, product teams need to look 2-5 years into the future.
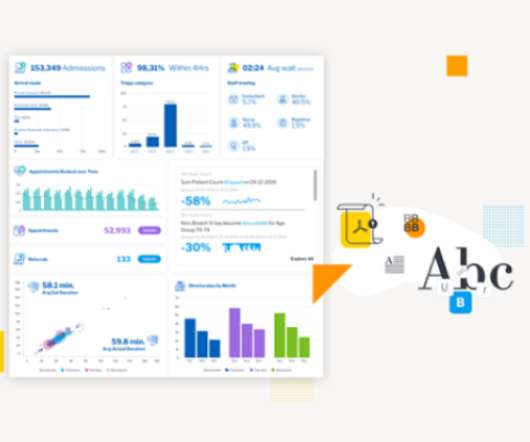
You know your product collects tons of data. Datavisualizationtools help turn your messy spreadsheets into clear, interactive insights. The best ones dont even need SQL or data science skills. Because product analytics should be easy and accessible for everyone, not just data experts.
Embedding dashboards, reports and analytics in your application presents unique opportunities and poses unique challenges. We interviewed 16 experts across business intelligence, UI/UX, security and more to find out what it takes to build an application with analytics at its core.
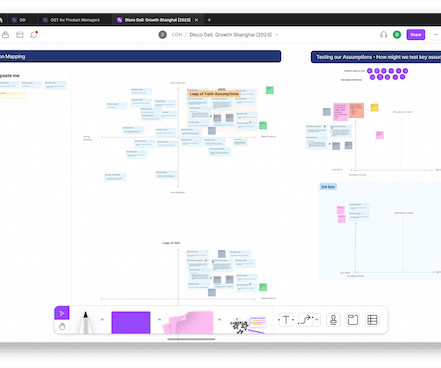
The opportunity solution tree helps visualize all the work that goes into continuous discovery. And while opportunity solution trees have become increasingly common among product teams, there’s still plenty of room for customization, both in the way you set up your trees and the tools you use to build them.
For example, if your brand centers around being a data-driven decision-maker, ensure that your communications emphasize this. Share case studies, write posts that highlight your analytical approach, and offer insights backed by data. Share your learnings through social media, presentations, or internal discussions.
This post is about making these ideas concrete through a set of guidelines, templates, and JIRA+Excel tips so you can create effective status and progress reports quickly, have less meetings , and get out of the building , which is where you need to be. Templates and tips for less status meetings. Progress / Status.
Proactive Problem Solving Doug was motivated to write Proactive Problem Solving by two pieces of data showing the impact of reactive problem solving: The average manager wastes 3.5 When presenting new ideas, especially those that challenge existing systems, people naturally feel stress. hours every day dealing with problems.
Organizations look to embedded analytics to provide greater self-service for users, introduce AI capabilities, offer better insight into data, and provide customizable dashboards that presentdata in a visually pleasing, easy-to-access format.
You see, although we work hard to make Userpilot the best product adoption tool on the market, we know it isnt the perfect fit for every business. Robust resource center functionalities for offering self-service help. Custom dashboards to track key metrics at a glance. for collecting user sentiment data.
Drawing from his 20+ years of technology experience and extensive research, Nishant shared insights about how these activities vary across different organizational contexts – from startups to enterprises, B2B to B2C, and Agile to Waterfall environments.
Note that Ive decided not to state the names of the tools I found, partly as the AI landscape is changing rapidly and partly as you should research and select the tools that work best in your context rather than trusting my judgment. [2] 2] Market Research AI-based tools can discover user and customer trends using predictiveanalytics.
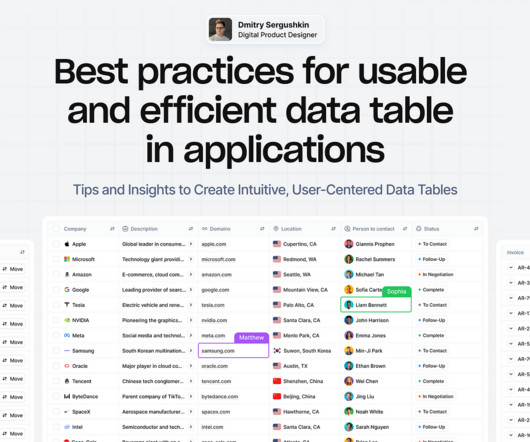
Tips and Insights to Create Intuitive, User-Centered DataTables Data tables provide a structured way to organize and manage information, making it easier to analyze and visualizedata effectively. However, creating effective data tables is not as simple as organizing rows and columns.
Speaker: Dean Yao, Director of Marketing at Jinfonet
What's the next big trend in analytics software and applications? You've probably used it without even knowing: embedded reporting and analytics. Software development teams more often now are embedding 3rd party analytics solutions into their products and applications to let them focus on other core areas of their software.
Pro Tip: Pair your quick wins with data. A dashboard showing metrics like feature adoption or user engagement amplifies your credibility. Advanced Tactics: Stakeholder Mapping: Use tools like the Stakeholder Alignment Blueprint (available on jonihoadley.com) to identify key goals and concerns. Click here to download.
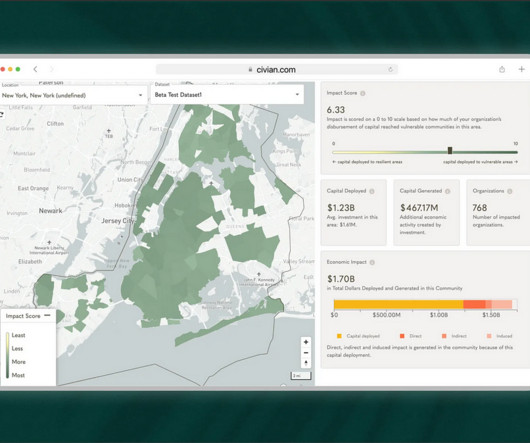
Case Study: Improving Data-Driven Decision Making for CSR Leadership Civian is a data-driven platform designed to help businesses measure, optimize, and showcase the social and economic impact of their investments in communities. Feature Engagement Users most frequently gravitated toward the map to explore and compare data.
Below is a preview of key insights. Make switching easier Allow parallel use with existing tools and automate data migration from competitors. Create a self-initiated MVP even a simple landing page or automation tool. Q: How do I shift leaderships focus from data obsession to actual product development?
The collaboration between AMS and MIT researchers has yielded impressive results, with AI tools not only matching human analysts in identifying customer needs but often exceeding themespecially for emotional needs that humans might overlook. But it is changing, with AI tools that are transforming how we uncover and analyze customer needs.
In this blog, we explore 5 key principles that exist to ensure you create a relevant dashboard that guides and simplifies the user experience, makes it as easy as possible to interpret what is presented no matter its complexity, and increases the adoption of BI.
Reveal Embedded AnalyticsData-driven companies have a hidden advantage! Theyve consistently outperformed their counterparts, reporting significantly higher metrics across operational efficiency (81% vs. 58%) , revenue growth (77% vs. 61%), and employee satisfaction (68% vs. 39%). How is this possible?
Or rather, two – conversation topics and custom reports. Well, my panel today are no strangers to asking that same question in conversations they have with each other, as they have been instrumental in our recent release of custom reports and conversation topics. Opening new possibilities with custom reports. Thomas: Awesome.
Quantitative data alone doesn’t reveal intent, only outcomes. By combining contextual insights from session replays , heatmaps, and behavior analytics, user session analysis helps you interpret metrics through the lens of real user journeys. Tools can track every click and interaction.
In fact, the 2024 Buyer Experience Report by 6sense found that a whopping 85% of buyers establish purchase requirements before even contacting sales. Step 2: Collect internal assets Once you’ve decided on your use case, it’s time to dig into your internal assets to gather crucial customer data. moments along your customer journey.
Speaker: speakers from Verizon, Snowflake, Affinity Federal Credit Union, EverQuote, and AtScale
Join this webinar panel for practical advice on how to build and foster a data literate, self-service analysis culture at scale using a semantic layer. In this webinar you will learn about: Making data accessible to everyone in your organization with their favorite tools.
In our latest Productside webinar, Becoming an Effective Product Management Leader , Principal Consultants Roger Snyder and Kenny Kranseler delivered a no-nonsense roadmap for new leaders who want to nail their first 90 days (and beyond) and get the tools on how to become a product management leadereffectively. Show them the data they lack.
Explore the secrets of creating a successful Crypto Prediction and Opinion Platform, and provide users with insights to help them navigate the cryptocurrency market wisely. Crypto prediction platforms provide valuable insights into the volatile world of cryptocurrency markets, aiding users in making informed decisions.
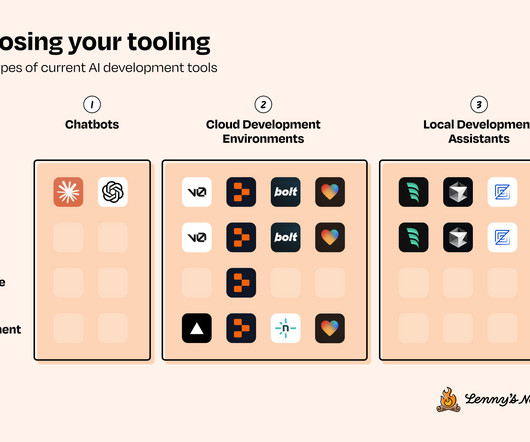
Whether you’re already deep into AI tools or just getting started, you’ll learn what tools you should be paying attention to, which tool to use when, and how to get unstuck when you run into an issue. Choosing your tooling Current AI development tools come in three types: Chatbots (e.g.
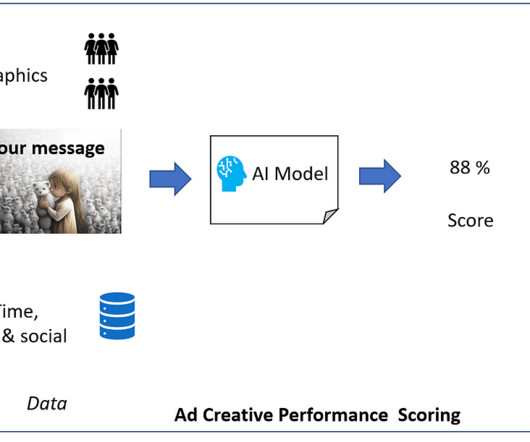
This is where predicting ad creative performance prior to testing comes in. By leveraging historical data and machine learning algorithms, marketers can make accurate predictions about how new ad creatives are likely to perform, without having to go through the process of testing each variation. This is no easy task.
Speaker: Laura Klein, Principal at Users Know and Author of UX for Lean Startups
That's why Laura Klein, product manager and UX designer, has a set of tips to help application teams improve their embedded dashboards and reports. How to avoid common mistakes people make when presentingdata. And yet we have so many of them in our lives. October 25, 2018 12:30 PM PST, 3:30 PM EST, 8:30 PM GMT
How product managers can use data to understand customers and create value. Today we are talking about making better product decisions that create customer value using the data you already have. Our mission at Indicative is to help businesses build better products through data. 5:36] What is a data warehouse?
Well start with an overview and explore how AI can take on tasks such as analyzing user data and automated prototyping to help professionals connect with users on a humanlevel. These advancements are revolutionizing how designers approach their work, making UX more data-driven, efficient, and user-focused than everbefore.
Looking for a Google Analytics alternative that offers better customization, improved product analytics , and more data accuracy? TL;DR Google Analytics is an analytics platform offered by Google that helps businesses track website or app performance. Limited data control and ownership.
Multiple industries are suddenly forced to move operations online, and support teams are at the forefront of this transformation – battling every day to deliver excellent, fast customer service, while facing an unprecedented volume of enquiries and issues. Sophisticated reporting for valuable insights.
Speaker: Carrie Melissa Jones Founder, Gather Community Consulting
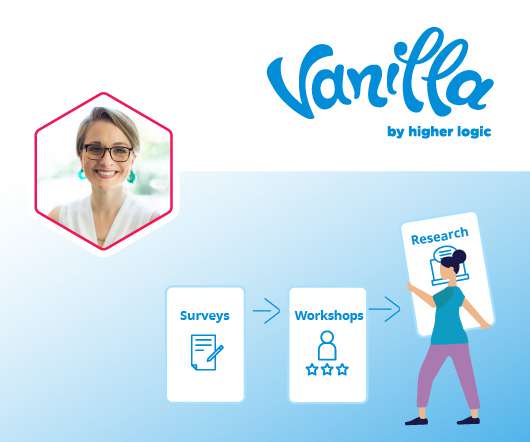
They can use insights, advice, and qualitative data about community members to build successful, promising communities. Register to get practical advice on how to: Present a case for why research matters to various parts of your organization. Make sure you don’t miss out on this incredibly insightful webinar!
Does the thought of quantitative data analysis bring back the horrors of math classes? But conducting quantitative data analysis doesn’t have to be hard with the right tools. Want to learn how to turn raw numbers into actionable insights on how to improve your product? Collecting and cleaning data.
Listen to the audio version of this article: [link] A Product Strategy System The product strategy system in Figure 1 consists of four main parts: people, processes, principles, and tools. Are the right tools applied? Next, collect the relevant data. Are they properly empowered and adequately qualified? If so, what are they?
Organizations that rely on a single-channel feedback approach may overlook valuable insights. These missing insights are crucial for understanding customer needs and expectations. Omnichannel feedback allows businesses to capture insights from every touchpoint, creating a 360-degree view of the customer journey.
They hesitated to make drastic changes without solid data backing them up. But good data-driven decision-making isn’t highly uncommon. So here’s how Brikker would use the BADIR data analysis framework to overcome all the reasons startup pivots fail. They’ll use data to solve these issues without considering the big picture.
Speaker: Amanda Stockwell, President of Stockwell Strategy
However, if you're willing to adapt the right way, you don't have to sacrifice agility or user insights. Using the right strategy, your agile team will collect qualitative data, interpret it, and integrate it effectively. Data analysis and integration. In this webinar, she'll make specific suggestions around: Team makeup.
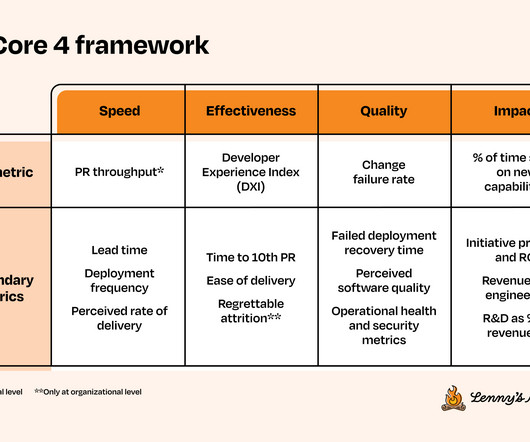
Her background is in developer tools and distributed systems. Quantitative measurements provide insight into what is happening, but qualitative insights tell us why. With Core 4, you can collect a baseline measurement via self-reported metrics. For more, check out her LinkedIn and her blog.
Thanks to the abundance of tools out there, marketing has never been easier. In this article, we examine some tools that can help your SaaS team to drive product growth. We will also consider valuable examples of tools that can inspire your process. The best examples are Userpilot , Hotjar , and Google Analytics.
ProductPlan excels in planning, visualizing, and communicating product strategies , notably through creating a comprehensive product roadmap. Asana is a top project management tool for helping teams organize, track, and manage work efficiently. It quickly gathers insights and validates designs.
Companies that simply shrink their desktop questionnaires to fit smaller screens end up with frustrated users and compromised data. Real-time insights: Collecting feedback at the point of experience provides valuable, real-time insights. You can then act faster on the insight to prevent churn and improve the customer experience.
Speaker: Miles Robinson, Technical Project Manager, iFixIt
How to frame the data to help make that decision can be done by instinct, or it can be done SMART: Specific definition of the project scope and completion. Each of the tools can be used in isolation or together, and they all help to bring clarity and structure to the data you will need to make the best use of your time, money and people.
We organize all of the trending information in your field so you don't have to. Join 96,000+ users and stay up to date on the latest articles your peers are reading.
You know about us, now we want to get to know you!
Let's personalize your content
Let's get even more personalized
We recognize your account from another site in our network, please click 'Send Email' below to continue with verifying your account and setting a password.


Let's personalize your content