This site uses cookies to improve your experience. To help us insure we adhere to various privacy regulations, please select your country/region of residence. If you do not select a country, we will assume you are from the United States. Select your Cookie Settings or view our Privacy Policy and Terms of Use.
Cookie Settings
Cookies and similar technologies are used on this website for proper function of the website, for tracking performance analytics and for marketing purposes. We and some of our third-party providers may use cookie data for various purposes. Please review the cookie settings below and choose your preference.
Used for the proper function of the website
Used for monitoring website traffic and interactions
Cookie Settings
Cookies and similar technologies are used on this website for proper function of the website, for tracking performance analytics and for marketing purposes. We and some of our third-party providers may use cookie data for various purposes. Please review the cookie settings below and choose your preference.
Strictly Necessary: Used for the proper function of the website
Performance/Analytics: Used for monitoring website traffic and interactions
You know your product collects tons of data. Datavisualizationtools help turn your messy spreadsheets into clear, interactive insights. The best ones dont even need SQL or data science skills. Because product analytics should be easy and accessible for everyone, not just data experts.
The “shiny penny” approach (focus all your attention on the hottest tools in the market) or “head in the sand” approach (fall victim to analysis paralysis and avoid choosing any tools) are no longer viable. But here’s the thing: a tool is not a strategy. The anatomy of a marketing tech stack [with recommended tools].
Every company, of every size — even organizations of just one person — are navigating a data avalanche problem. Every team — from product to marketing, and IT to engineering — is generating data. A strong analytics stack is foundational to being able to make sense of it all. Data Tracking and Collection. Event Data.
TL;DR A business intelligence (BI) analyst is a data specialist who helps businesses translate raw data into actionable insights. According to Glassdoor data, the estimated total pay for a Business Intelligence Analyst in the United States is $134,912 per year, with a base salary of $99,503 and additional pay of $35,409.
Tracking cross-platform analytics is essential for product teams to see a complete view of customer behavior. TL;DR Cross-platform analytics is the activity of tracking and analyzing user behavior across multiple platforms or devices. Tools like Google Analytics or Amplitude allow you to track user behavior across all platforms.
Master Google Analytics 4 for user behavior analysis, UX design optimization, and enhanced website performance to improve sales. Hi there, I was looking into Google Analytics 4 and found an article by Alice Emma Walker. If you know about Universal Analytics , it’s going away on July 1, 2024. It’s six years old.
Reveal Embedded Analytics. Collecting data is easy, yet interpreting that same data is difficult. This is where tools such as Reveal and Looker come in handy – they convert raw data into easy-to-understand and easy-to-use insights that enable organizations to reshape and modernize the way they do business.
Reveal Embedded Analytics. Choosing the right embedded analytics platform for your business needs is paramount. Table of contents: What are embedded analytics platforms? Embedded analytics benefits Top 7 embedded analytics platforms Reveal Looker Toucan Sisense Logi analytics Tableau Power BI.
In the age of data and analytics, we’ve come to believe that, with enough data, we can make smart decisions and become truly data-driven. But as the global data volume has gone from big to enormous, many businesses today find themselves thinking: What do we do with it? The “ABCs” of data.
Omnichannel analytics enable teams to get a 360 view of user behavior at different touchpoints of the customer journey. In particular, it covers: What omnichannel analytics are Why it’s important to track How to implement your omnichannel analytics strategy Omnichannel analyticstools Let’s get right into it!
Data is the most valuable asset of our time. Part of the challenge is that the language of data isn’t always intuitive to our very human minds. In this article, you’ll learn about a new genre of customer analytics capabilities that speak the language of people, rather than systems. The role of modern BI. The limitations of SQL.
Are you looking for Zendesk integrations to boost the efficiency of your self-service customer support? The article explores the best Zendesk integrations for: Customer support Customer feedback Productivity Email and social media communication Analytics and reporting Let's get right to it! If so, you’re in the right place!
In this interview, Tristan gives us his thoughts on the data stack of today and the hopefully improved capability and accessibility of tomorrow’s. Ask Tristan Handy what he thinks the future of the data stack will look like and what you’ll get in return is a history lesson. The data-analysis gaps of yesterday and today.
Reveal Embedded Analytics. Among all embedded analytics products on the market, Tableau is certainly one of the most popular BI tools for analyzing, visualizing, and working with data. Tableau has been helping businesses to transform raw data into valuable insights for more than 16 years.
From understanding the analytics landscape to mapping capabilities with KPIs and integrating new tools with your current stack, we know that choosing a product analytics solution can be overwhelming—not to mention, time-consuming. How is Mixpanel different from marketing analyticstools like Google Analytics?
TL;DR A business intelligence (BI) analyst is a data specialist who helps businesses translate raw data into actionable insights. The career path of a business intelligence analyst is not linear, but there are common stages you can expect as you gain experience and expertise. Let’s dive in!
Whether you’re looking to deepen your expertise, stay updated with industry trends, or find practical tools to enhance your workflow, the right resources are essential for continuous growth and success. Looking to leverage product data for insights? Consider Userpilot for its engagement features and analytics capabilities.
TL;DR A product analyst is a professional who conducts product research , analyzes, and interprets such data to make accurate decisions about the product. Product analysis involves two major things: the product and the data. Looking into tools for product analysts? Let’s dive in! Product Analyst. Senior Product Analyst.
Today, about one-third of Americans have used a dating app or site, and 12% have either been in a committed relationship or gotten married to someone they met through online dating, according to a recent Pew Research report. Driven by Data, Powered by the Heart . Data is core to the mission here at OkCupid.
Whether the pricing model is monthly, yearly, or otherwise, subscription-based pricing models keep revenue relatively predictable. Product analytics help you uncover important insights to answer questions including what is your product’s key activation event that results in longer user retention? opportunities).
For marketing teams focused on getting more user traffic and signups, Google Analytics has been the tool of choice. But with customers spending more time researching and buying online, websites and product experiences are converging to accommodate customer needs, and the scope of analysis for most marketers is increasing.
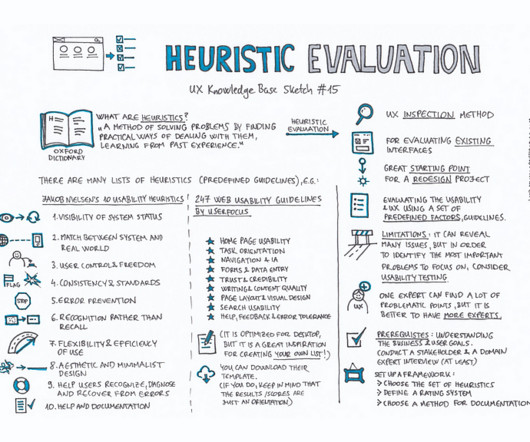
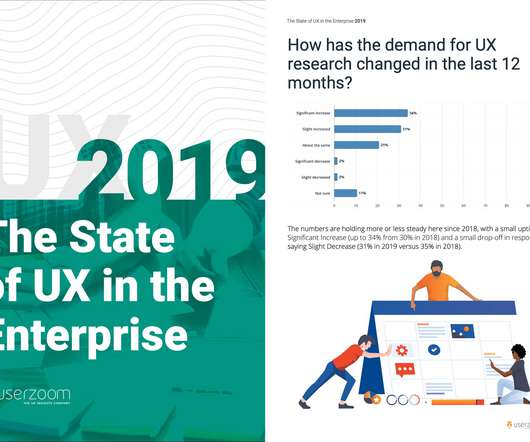
This free-to-download bundle contains all the following resources: How to include user research in early product development. Democratizing UX: how to spread user research education and insights throughout your organization. How to Run UserExperience in Agile [on-demand webinar]. Download the library.
Where does product analytics fit in the realm of analyticstools on the market? What makes product analytics different from marketing analytics? How are product teams using analytics in their day-to-day work? Hint: Skip to 3:45 to learn how Amplitude compares to BI tools and marketing analytics.).
Where does product analytics fit in the realm of analyticstools on the market? What makes product analytics different from marketing analytics? How are product teams using analytics in their day-to-day work? Hint: Skip to 3:45 to learn how Amplitude compares to BI tools and marketing analytics.).
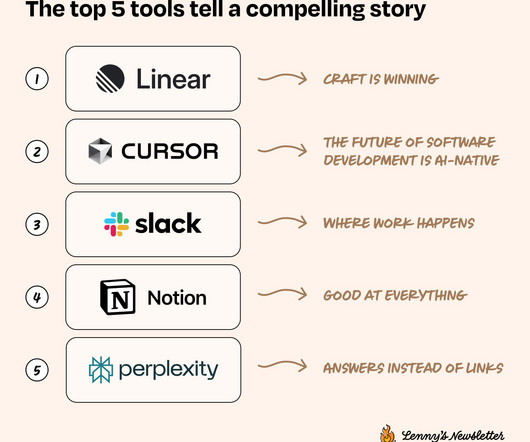
Subscribe now For more: Lennybot | Podcast | Swag | Hire your next product leader | My favorite courses I’ve always been fascinated by what tools people choose to use in their work. Today, with insights from over 6,500 of you (thank you! As the third-most-used tool overall, Slack continues to crush it. 5% use Bolt.
The modern data stack came bearing many promises. A shift from the on-premise legacy systems, it aimed to provide a faster, scalable, and more cost-effective way 0f storing and analyzing data. Instead of easing data management, modern cloud data warehouses created a new set of problems.
We organize all of the trending information in your field so you don't have to. Join 96,000+ users and stay up to date on the latest articles your peers are reading.
You know about us, now we want to get to know you!
Let's personalize your content
Let's get even more personalized
We recognize your account from another site in our network, please click 'Send Email' below to continue with verifying your account and setting a password.


Let's personalize your content