This site uses cookies to improve your experience. To help us insure we adhere to various privacy regulations, please select your country/region of residence. If you do not select a country, we will assume you are from the United States. Select your Cookie Settings or view our Privacy Policy and Terms of Use.
Cookie Settings
Cookies and similar technologies are used on this website for proper function of the website, for tracking performance analytics and for marketing purposes. We and some of our third-party providers may use cookie data for various purposes. Please review the cookie settings below and choose your preference.
Used for the proper function of the website
Used for monitoring website traffic and interactions
Cookie Settings
Cookies and similar technologies are used on this website for proper function of the website, for tracking performance analytics and for marketing purposes. We and some of our third-party providers may use cookie data for various purposes. Please review the cookie settings below and choose your preference.
Strictly Necessary: Used for the proper function of the website
Performance/Analytics: Used for monitoring website traffic and interactions
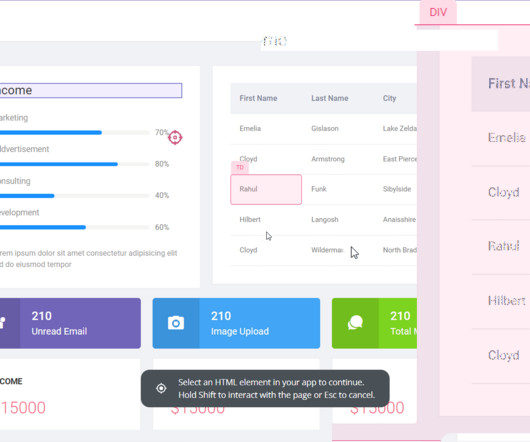
You know your product collects tons of data. Datavisualizationtools help turn your messy spreadsheets into clear, interactive insights. The best ones dont even need SQL or data science skills. Because productanalytics should be easy and accessible for everyone, not just data experts.
As you’re researching dashboardreportingtools, you’ve probably noticed how hard it is to find reliable information on the available solutions. TL;DR Dashboards display critical business data in real-time, streamlining decision-making and focusing on key metrics. Let’s dive in!
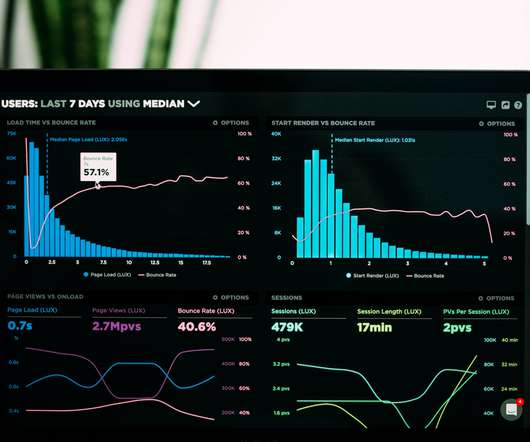
With companies relying entirely on data, it’s common sense to carry out SaaS reporting. The different reports can offer a variety of insights that help manage your product in the right direction. TL;DR SaaS reporting helps to track key metrics and inform the right decisions backed up with data.
Experts predict the Customer Analytics market will top $24 billion by 2025. That growth is driven by a common difficulty facing many of today’s businesses—mountains of data and no way for non-technical people to make sense of it. That’s where Customer Analytics comes in. Common features. Major players in the space.
Omnichannel analytics enable teams to get a 360 view of user behavior at different touchpoints of the customer journey. In particular, it covers: What omnichannel analytics are Why it’s important to track How to implement your omnichannel analytics strategy Omnichannel analyticstools Let’s get right into it!
Tracking cross-platform analytics is essential for product teams to see a complete view of customer behavior. TL;DR Cross-platform analytics is the activity of tracking and analyzing user behavior across multiple platforms or devices. Tools like Google Analytics or Amplitude allow you to track user behavior across all platforms.
Are you looking for Zendesk integrations to boost the efficiency of your self-service customer support? The article explores the best Zendesk integrations for: Customer support Customer feedback Productivity Email and social media communication Analytics and reporting Let's get right to it!
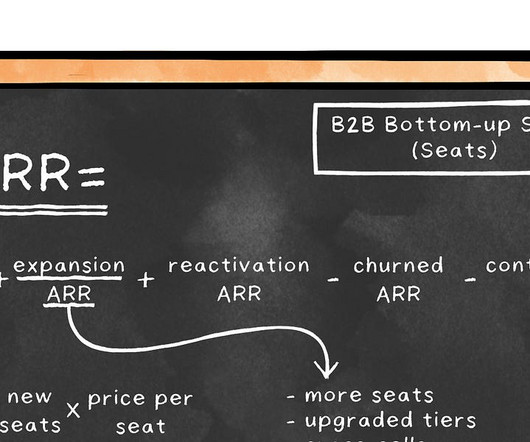
Compared to one-time-purchase software, SaaS products offer a few key benefits. Whether the pricing model is monthly, yearly, or otherwise, subscription-based pricing models keep revenue relatively predictable. Are users interacting with in-app features in the ways you want them to? opportunities). opportunities).
Embarking on a career as a customer insights manager involves a combination of education, skills development, and practical experience. This guide will provide you with a comprehensive overview of the path to becoming a successful customer insights manager. Let’s dive in!
Each week I tackle reader questions about building product, driving growth, and accelerating your career. If you’re not a subscriber, here’s what you missed this month: What to do if your product isn’t taking off First-principles thinking Inspiration for the year ahead Subscribe to get access to these posts, and every post.
Testing in production is becoming more and more common across tech. The most significant benefit is knowing that your features work in production before your users have access. The following plan is both guidance and order of operations for what to implement if you want to start testing in production. The First 30 Days.
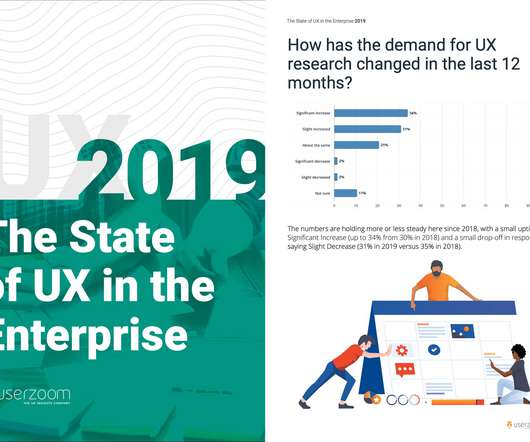
UX Researcher Samantha Alaimo from GrubHub and Michael Mancuso , Director of UX, Digital Education at Wiley, for their recommendations on getting everyone in the UX team and throughout the organization onboard with a standardized research process. Everything you need to integrate user research into product development!
Time and again, folks have used productanalyticstools to better understand their customers. Businesses use analytics to determine product health, improve the customer experience, test product-market fit, and ensure that they are making the right investments with limited time and resources.
Each week, I tackle reader questions about building product, driving growth, and accelerating your career. If you’re not a subscriber, here’s what you missed this month: A guide to AI prototyping for product managers Introducing Core 4: The best way to measure and improve your product velocity Top angel investors in the U.S.
We organize all of the trending information in your field so you don't have to. Join 96,000+ users and stay up to date on the latest articles your peers are reading.
You know about us, now we want to get to know you!
Let's personalize your content
Let's get even more personalized
We recognize your account from another site in our network, please click 'Send Email' below to continue with verifying your account and setting a password.


Let's personalize your content