This site uses cookies to improve your experience. To help us insure we adhere to various privacy regulations, please select your country/region of residence. If you do not select a country, we will assume you are from the United States. Select your Cookie Settings or view our Privacy Policy and Terms of Use.
Cookie Settings
Cookies and similar technologies are used on this website for proper function of the website, for tracking performance analytics and for marketing purposes. We and some of our third-party providers may use cookie data for various purposes. Please review the cookie settings below and choose your preference.
Used for the proper function of the website
Used for monitoring website traffic and interactions
Cookie Settings
Cookies and similar technologies are used on this website for proper function of the website, for tracking performance analytics and for marketing purposes. We and some of our third-party providers may use cookie data for various purposes. Please review the cookie settings below and choose your preference.
Strictly Necessary: Used for the proper function of the website
Performance/Analytics: Used for monitoring website traffic and interactions
You know your product collects tons of data. Datavisualizationtools help turn your messy spreadsheets into clear, interactive insights. The best ones dont even need SQL or data science skills. Because product analytics should be easy and accessible for everyone, not just data experts.
As you’re researching dashboardreportingtools, you’ve probably noticed how hard it is to find reliable information on the available solutions. TL;DR Dashboards display critical business data in real-time, streamlining decision-making and focusing on key metrics. Let’s dive in!
If you are a SaaS company, the chances are you’ve come across the term “self-serve analytics” at some point online. Unlike traditional data analysis methods, self-serve analytics equips everyone in your organization to explore data and take the right actions in real time. Choosing a good business intelligence tool.
With companies relying entirely on data, it’s common sense to carry out SaaS reporting. The different reports can offer a variety of insights that help manage your product in the right direction. You just need to ensure you can get started correctly and the metrics you should report on to get the critical metrics.
Speaker: Richard Cheng, Associate Product Manager, Mark43
Mark43 is on a mission to bring public safety data management into the 21st century. To fix traditionally paper-heavy and error-prone processes, they needed a secure and easy-to-use product experience that simplified and unified crime data collection and management. How efficient intelligence and analytics will benefit your users.
What Google’s and Salesforce’s respective acquisition of Looker and Tableau Software means for CIO’s The BI analyticstool space is consolidating to compete against Microsoft’s ensemble of Business Analytics(BA) products which promises to solve for the entire workflow?—?data Because Data is the new currency.
Experts predict the Customer Analytics market will top $24 billion by 2025. That growth is driven by a common difficulty facing many of today’s businesses—mountains of data and no way for non-technical people to make sense of it. That’s where Customer Analytics comes in. Common Customer Analytics Features.
The “shiny penny” approach (focus all your attention on the hottest tools in the market) or “head in the sand” approach (fall victim to analysis paralysis and avoid choosing any tools) are no longer viable. But here’s the thing: a tool is not a strategy. The anatomy of a marketing tech stack [with recommended tools].
Every company, of every size — even organizations of just one person — are navigating a data avalanche problem. Every team — from product to marketing, and IT to engineering — is generating data. A strong analytics stack is foundational to being able to make sense of it all. Data Tracking and Collection. Event Data.
Speaker: Eric Feinstein, Professional Services Manager, Looker
For a long time, Product Managers have found it challenging to design interfaces inside their products that users could use for reporting. It seems like PMs and engineers have grown to hate embedded reporting. How to evaluate embedded analytic solutions as strategy to greatly reduce initial and on-going engineering effort.
In 2019, industry-leading Business Intelligence tools (BI tools), Looker and Tableau, were acquired by Google and Salesforce for over $18 billion combined. These massive deals show that BI tools and data warehouses are a powerful combo that companies across the globe are incorporating into their tech stacks.
TL;DR A business intelligence (BI) analyst is a data specialist who helps businesses translate raw data into actionable insights. According to Glassdoor data, the estimated total pay for a Business Intelligence Analyst in the United States is $134,912 per year, with a base salary of $99,503 and additional pay of $35,409.
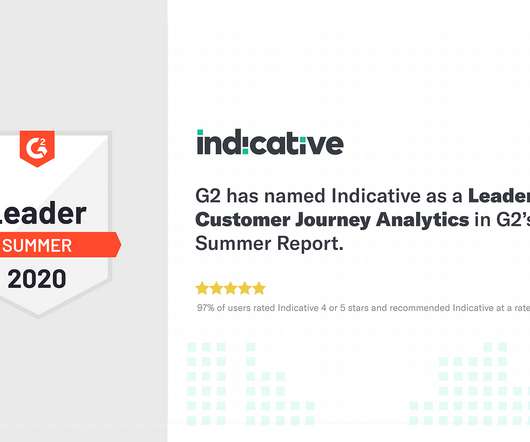
G2 has named Indicative as a Leader in Customer Journey Analytics in G2’s 2020 Summer Report. . Indicative is the only Customer Analytics platform designed specifically for non-technical business users that connects directly to your data warehouse. High Performer in Digital Analytics. Why We’re Leaders.
Tracking cross-platform analytics is essential for product teams to see a complete view of customer behavior. TL;DR Cross-platform analytics is the activity of tracking and analyzing user behavior across multiple platforms or devices. Tools like Google Analytics or Amplitude allow you to track user behavior across all platforms.
Speaker: Sam Owens, Product Management Lead, Namely Platform
Sam and Jessica faced a problem that many product managers face: their customers wanted better analytics and reporting, but analytics wasn’t the core function of the SaaS product Sam and Jessica manage. If your users would want analytics as part of their interface, you don't want to miss this session.
Reveal Embedded Analytics. Collecting data is easy, yet interpreting that same data is difficult. This is where tools such as Reveal and Looker come in handy – they convert raw data into easy-to-understand and easy-to-use insights that enable organizations to reshape and modernize the way they do business.
Reveal Embedded Analytics. Choosing the right embedded analytics platform for your business needs is paramount. Table of contents: What are embedded analytics platforms? Embedded analytics benefits Top 7 embedded analytics platforms Reveal Looker Toucan Sisense Logi analytics Tableau Power BI.
Master Google Analytics 4 for user behavior analysis, UX design optimization, and enhanced website performance to improve sales. Hi there, I was looking into Google Analytics 4 and found an article by Alice Emma Walker. If you know about Universal Analytics , it’s going away on July 1, 2024. It’s six years old.
In 2019, industry-leading Business Intelligence (BI) tools, Looker and Tableau, were acquired by Google and Salesforce for over $18 billion combined. More recently in 2020, cloud-based data warehouse Snowflake went public at an eye-popping market capitalization of $70 billion. But there are two significant drawbacks to BI.
Speaker: Kate Owens and Megan Bubley, SpotHero, Diana Smith, Segment, and Erin Franz, Looker
As a product leader, you are tasked with collecting and synthesizing your customer’s interactions with your product.The great news is that there are many tools used across your company which collect unique parts of your user’s journey. As your sources of data increase, so do the complexities of unifying the data in a meaningful way.
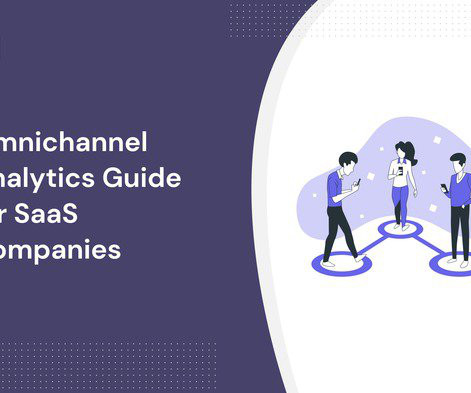
Omnichannel analytics enable teams to get a 360 view of user behavior at different touchpoints of the customer journey. In particular, it covers: What omnichannel analytics are Why it’s important to track How to implement your omnichannel analytics strategy Omnichannel analyticstools Let’s get right into it!
Data is the most valuable asset of our time. Part of the challenge is that the language of data isn’t always intuitive to our very human minds. In this article, you’ll learn about a new genre of customer analytics capabilities that speak the language of people, rather than systems. The role of modern BI. The limitations of SQL.
In the age of data and analytics, we’ve come to believe that, with enough data, we can make smart decisions and become truly data-driven. But as the global data volume has gone from big to enormous, many businesses today find themselves thinking: What do we do with it? The “ABCs” of data.
Mixpanel is an analytics company, so I don’t have to tell you that we highly value using analytics to make better decisions and optimize the running of our business. Up until now, that was handled by Mixpanel and Looker, our BI (business intelligence) solution of choice. Why is this so important to share?
Speaker: Andrew Wynn, Senior Product Manager, Looker
As a product manager, you know how helpful custom tailored data solutions can be to doing your job well. But proper dataanalytics solutions take work to deliver - it's not as simple as just building a dashboard. Learn product analytics best practices from Andrew Wynn, Product Manager at Looker.
Are you looking for Zendesk integrations to boost the efficiency of your self-service customer support? The article explores the best Zendesk integrations for: Customer support Customer feedback Productivity Email and social media communication Analytics and reporting Let's get right to it! If so, you’re in the right place!
In another blog , we provided a look at how we implemented a product-led growth (PLG) strategy at Mixpanel from a data and analytics perspective. In this blog, I’ll pick up where we left off by walking through what we do with all of this joined data in BigQuery. Data structure for our Mixpanel project.
Key Tasks User issues reports. Identify key quality metrics and create dashboards to track real-time product health. Bug Service Level Agreement (SLA). Identify measures of success, create dashboards for tracking, and report on progress to ensure team’s know whether or not they’re hitting the mark. Data analysis.
In this interview, Tristan gives us his thoughts on the data stack of today and the hopefully improved capability and accessibility of tomorrow’s. Ask Tristan Handy what he thinks the future of the data stack will look like and what you’ll get in return is a history lesson. The data-analysis gaps of yesterday and today.
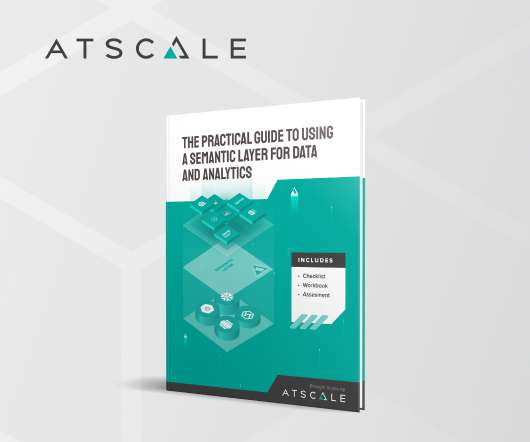
Download this guide for practical advice on how to use a semantic layer to unlock data for AI & BI at scale. Read this guide to learn: How to make better, faster, and smarter data-driven decisions at scale using a semantic layer. How to enable data teams to model and deliver a semantic layer on data in the cloud.
Reveal Embedded Analytics. Among all embedded analytics products on the market, Tableau is certainly one of the most popular BI tools for analyzing, visualizing, and working with data. Tableau has been helping businesses to transform raw data into valuable insights for more than 16 years.
Embarking on a career as a customer insights manager involves a combination of education, skills development, and practical experience. This guide will provide you with a comprehensive overview of the path to becoming a successful customer insights manager. Let’s dive in!
TL;DR A business intelligence (BI) analyst is a data specialist who helps businesses translate raw data into actionable insights. Many successful BI analysts have transitioned from other fields by demonstrating their passion for data and acquiring the necessary skills through alternative routes. Let’s dive in!
From understanding the analytics landscape to mapping capabilities with KPIs and integrating new tools with your current stack, we know that choosing a product analytics solution can be overwhelming—not to mention, time-consuming. How is Mixpanel different from marketing analyticstools like Google Analytics?
When it comes to the four pillars of product analytics maturity , collaboration is the part we on Mixpanel’s Customer Success team are asked about the most: “How can we improve our collaboration?” ” “How do we improve data sharing between teams?” ” “How do we create a data culture?”
Whether you’re looking to deepen your expertise, stay updated with industry trends, or find practical tools to enhance your workflow, the right resources are essential for continuous growth and success. Looking to leverage product data for insights? Consider Userpilot for its engagement features and analytics capabilities.
TL;DR A product analyst is a professional who conducts product research , analyzes, and interprets such data to make accurate decisions about the product. Product analysis involves two major things: the product and the data. Looking into tools for product analysts? Let’s dive in! Product Analyst. Senior Product Analyst.
It wasn’t long before Andrew broke into the startup world while running the data and catalog team at Instacart. After witnessing firsthand the strong relationship between analytics, product, and performance, Andrew grew a passion for making data integration a top priority for everyone–even for traditionally non-technical roles.
Today, about one-third of Americans have used a dating app or site, and 12% have either been in a committed relationship or gotten married to someone they met through online dating, according to a recent Pew Research report. Driven by Data, Powered by the Heart . Data is core to the mission here at OkCupid.
Originally published June 2, 2022 By Brian LaFaille, former Global Head of CS Strategic Programs at Looker Digital Customer Success is for everyone. We caught up with Brian LaFaille, former Global Head of Customer Success Strategic Programs at Looker, to get his take on segmentation and how they score customers at Looker.
For marketing teams focused on getting more user traffic and signups, Google Analytics has been the tool of choice. This is why we launched Mixpanel Marketing Analytics. If you want to skip right to seeing for yourself how Mixpanel Marketing Analytics works, you can play around with our public Board here.
Whether the pricing model is monthly, yearly, or otherwise, subscription-based pricing models keep revenue relatively predictable. Product analytics help you uncover important insights to answer questions including what is your product’s key activation event that results in longer user retention? opportunities).
An inspiring vision should help people understand how their work contributes to individual users, by explaining what your product or service aims to do for users. Architecture and developer tooling : we’ve built tools and abstractions so that most engineers don’t need to worry about infrastructure (e.g.
It is one thing to wax philosophically about “translating strategy”, “using data”, and “aligned autonomy”, and another thing to make it happen in the real world at a rapidly growing company. I found myself writing stories, pulling together some analytics, doing ‘normal’ Product Manager things.
We organize all of the trending information in your field so you don't have to. Join 96,000+ users and stay up to date on the latest articles your peers are reading.
You know about us, now we want to get to know you!
Let's personalize your content
Let's get even more personalized
We recognize your account from another site in our network, please click 'Send Email' below to continue with verifying your account and setting a password.


Let's personalize your content