This site uses cookies to improve your experience. To help us insure we adhere to various privacy regulations, please select your country/region of residence. If you do not select a country, we will assume you are from the United States. Select your Cookie Settings or view our Privacy Policy and Terms of Use.
Cookie Settings
Cookies and similar technologies are used on this website for proper function of the website, for tracking performance analytics and for marketing purposes. We and some of our third-party providers may use cookie data for various purposes. Please review the cookie settings below and choose your preference.
Used for the proper function of the website
Used for monitoring website traffic and interactions
Cookie Settings
Cookies and similar technologies are used on this website for proper function of the website, for tracking performance analytics and for marketing purposes. We and some of our third-party providers may use cookie data for various purposes. Please review the cookie settings below and choose your preference.
Strictly Necessary: Used for the proper function of the website
Performance/Analytics: Used for monitoring website traffic and interactions
Without effective UX analytics that goes beyond collecting data, you’re losing valuable customers. Unfortunately, the research backs this up, with a staggering 90% of usersreporting that they stopped using an app due to poor performance. Basically, anything that ruins the userexperience.
Using a custom ChatGPT model combined with collaborative team workshops, product teams can rapidly move from initial customer insights to validated prototypes while incorporating strategic foresight and market analysis. Instead of focusing solely on today’s customer problems, product teams need to look 2-5 years into the future.
Introduction to customer satisfaction surveys Customer satisfaction surveys are vital tools for understanding what customers think, feel, and experience. Surveys provide a range of insights, from quick feedback after a purchase to in-depth assessments of brand loyalty. Don’t worry, we’ve got you.
You can gather all the user feedback or behavioral data you want or even generate tons of Google Analyticsreports. Despite all these efforts, you’re probably still not acting on product analytics correctly. Why actionable product analytics are important. This causes siloed data and integration issues.
Dashboard design can mean the difference between users excitedly embracing your product or ignoring it altogether. Great dashboards lead to richer userexperiences and significant return on investment (ROI), while poorly designed dashboards distract users, suppress adoption, and can even tarnish your project or brand.
Reveal Embedded Analytics For product owners, leveraging data is not just an advantageits a necessity. Product analytics empowers you to understand gaps in your offering and how users engage with your product. Both embedded analytics and product analytics are designed to help product owners in diverse ways.
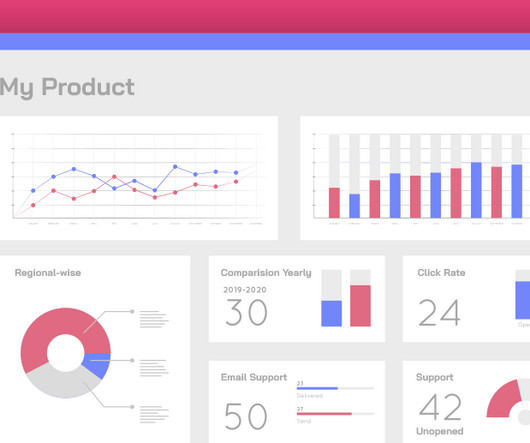
You know your product collects tons of data. Datavisualizationtools help turn your messy spreadsheets into clear, interactive insights. The best ones dont even need SQL or data science skills. Because product analytics should be easy and accessible for everyone, not just data experts.
As you might know, session replay tools track every click, scroll, and hiccup from your usersjust as if you were watching through their eyes. They allow you to close the gap between your analyticsdata and the feedback you get from users. But with so many session replay tools, which ones are worth your time and money?
Drawing from his 20+ years of technology experience and extensive research, Nishant shared insights about how these activities vary across different organizational contexts – from startups to enterprises, B2B to B2C, and Agile to Waterfall environments.
Are you looking for a session replay tool but not sure if Fullstory is the right option for your SaaS? The tool’s pros and cons. Understand drop-off points within user funnels to optimize conversion rates. Pinpoint bug locations by linking user sessions to bug reports or customer tickets. Fullstory pricing.
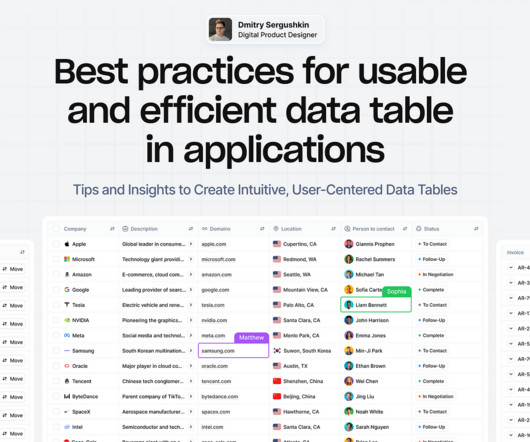
Tips and Insights to Create Intuitive, User-Centered DataTables Data tables provide a structured way to organize and manage information, making it easier to analyze and visualizedata effectively. Well-designed tables enable users to access, analyze, and act on critical information quickly and accurately.
1] Below are four examples of how this can be achieved. Note that Ive decided not to state the names of the tools I found, partly as the AI landscape is changing rapidly and partly as you should research and select the tools that work best in your context rather than trusting my judgment. [2]
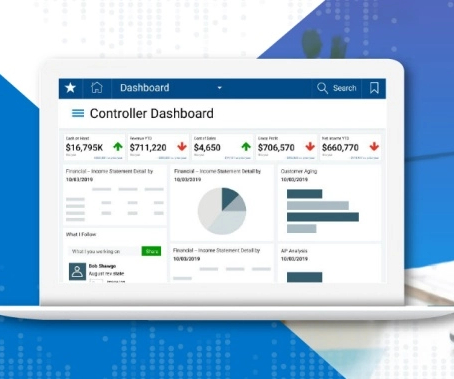
Reveal Embedded Analytics We know how difficult it is to create dashboards, especially for web applications. However, running business operations or targeted campaigns without insights into their effectiveness is not an option. Thats what dashboards are for. They track everything from user behavior to system performance.
Wouldn’t it be great to see all user interactions with your product as they happen? Think about all the insights you could gather to improve the userexperience. Session recordings vs. heatmaps While both heatmaps and session recordings shed light on user interactions, they provide different insights.
Are you struggling to make sense of scattered userdata? The right customer analytics platform helps you uncover exactly how customers interact with your product: so you can spot issues early, optimize user journeys, and drive sustainable growth. Pendo – the best software for product-led insights.
I’m going to take a wild guess and assume that you already understand the importance of mobile in-app feedback tools. You also might be reading this post thinking: “Who’s adding new tools to their tech stack right now?” Do you have the right tools to capture that voice? Mobile in-app feedback tools & solutions.
A classic example of this is the digital camera that disrupted the film industry and contributed to the collapse of Kodak. Collecting data at every touchpoint and simplifying the userexperience would be a huge effort for old insurance companies. 12:41] How are you using data? That gives us an advantage. [12:41]
When users interact more, it may seem like a win. However, without qualitative feedback and behavioral insights, teams risk misreading signals, leading to frustration and churn. Numbers alone can be misleading higher engagement doesnt always mean user satisfaction. Key differences between data types.
The choice is tough because there’s no single tool that covers all use cases. What’s worse, you will find multiple tools in each category, making it incredibly difficult to pick the tool that satisfies your needs and offers the best value for money. Which product feedback software should you choose for your SaaS?
Let’s get some help and learn how to talk about the importance of innovation with senior leaders and the tools that can help organizations be better at innovation. Bruce’s research, highlighted in the groundbreaking book Serial Innovators revealed fascinating insights into these exceptional team members.
In a fast-paced industry like SaaS, leveraging business analytics effectively can be the key to staying competitive and driving product growth. Business analytics offers invaluable insights that help SaaS companies optimize operations, enhance customer experiences, and make data-driven decisions.
If there is one thing thats altering the way we create userexperience (UX) designs and conduct research in 2024, it is definitely artificial intelligence (AI). Well start with an overview and explore how AI can take on tasks such as analyzing userdata and automated prototyping to help professionals connect with users on a humanlevel.
What happens when you build a product or service around what you think potential customers want, only for them to buy something else? It could include conducting user interviews and surveys, analyzing product usage data, and tracking customer feedback , to name a few.
Userexperience can make or break a web app. If your software is slow or buggy, users wont stick around for long. If youre only finding out about these issues after users complain, youre already too late. On top of that, Userpilot also offers in-app engagement tools you can use to act on the collected data.
Quantitative data alone doesn’t reveal intent, only outcomes. Thats why you need user session analysis. By combining contextual insights from session replays , heatmaps, and behavior analytics, user session analysis helps you interpret metrics through the lens of real user journeys.
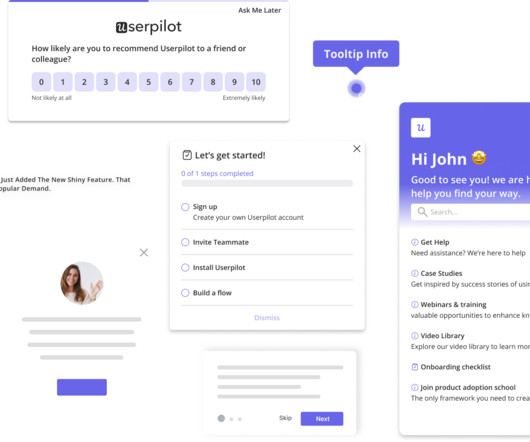
This survey can help you deliver tailored content to your audience with different onboarding elements: interactive walkthroughs , resource center , user onboarding checklists, tooltips, and surveys. Determine user roles to tailor their experiences. An omnichannel user engagement strategy unifies all of these channels.
Data-driven companies are 58% more likely to hit revenue goals. This shows how important business analytics is for your product. Business analytics gives insights that help you make better decisions to improve your product. This article will show seven examples of business analytics to highlight its positive impact.
Overview: Mobile app analytics metrics Below is a quick summary of the mobile metrics every PM should be tracking. For example, if you recently launched your mobile application and are focused on driving engagement, youll want to track app engagement metrics like DAU/MAU and feature adoption. Is the app making money?
Are you in need of some MarTech stack examples to inspire your own? Thanks to the abundance of tools out there, marketing has never been easier. In this article, we examine some tools that can help your SaaS team to drive product growth. We will also consider valuable examples of tools that can inspire your process.
Do you have the right tools to capture that voice? To help you with this, we compiled a list of the top mobile in-app feedback tools of 2021. Incorporating these tools into your customer experience tech stack will drive more engagement, gather high-quality customer feedback, and help inform your product roadmap.
Well implemented, product demos help to: Improve user engagement : Today’s B2B buyers are independent—they want to research and evaluate solutions on their own terms. In fact, the 2024 Buyer ExperienceReport by 6sense found that a whopping 85% of buyers establish purchase requirements before even contacting sales.
To gather the information needed to avoid this, quantitative data is a valuable tool for all startups. This article will examine quantitative data, the difference between quantitative and qualitative data, and how to collect the former. It is often shown in bar or pie charts.
Looking for a customer behavior analysis example to see how you can extract valuable insights? In this article, you will also learn how to conduct customer behavior analysis step-by-step and how Userpilot analytics can help. To gain meaningful insights, the analysis should focus on specific user segments.
Reveal Embedded Analytics Explore how these game-changing features can accelerate your products growth. Latest Update Features: Custom Toolbars: Full control over dashboard menus. Interactive Filtering: Compare data instantly. Axis Title Control: Sharpen data clarity. visualization title).
Looking for a Google Analytics alternative that offers better customization, improved product analytics , and more data accuracy? TL;DR Google Analytics is an analytics platform offered by Google that helps businesses track website or app performance. Limited data control and ownership.
Understanding how to analyze survey data doesn’t have to be complicated. With the right survey questions, you can gain insights into what your customers like and dislike about your brand, products, and services. The two main types of survey data are quantitative data and qualitative data.
Over the last few months, we’ve released updates that help you improve and measure your conversational support efforts, engage customers with multichannel transactional messaging and other customer engagement enhancements, and integrate the tools you use every day – including WhatsApp! ??. Best of all? Is it possible to do this with Intercom?
Do you desire a loyal fanbase that can’t get enough of your product or service? The solution might lie in your ability to create a comprehensive userexperience map. A well-crafted userexperience map can be your secret weapon for understanding customers, identifying pain points, and boosting product engagement.
Inclusive by Design: Transform Your UI/UX from Good to Great In todays digital landscape, ensuring accessibility is no longer optionalit is a critical aspect of designing user interfaces (UI) and userexperiences (UX). Some key disabilities to account forinclude: Visual impairments : Color blindness, low vision, or blindness.
Image by staffingsolutionsenterprises NPS survey example byLoom. NPS survey dashboard in UsrGuiding tool. In reality, UX is multidimensional, and it requires multiple qualitative and quantitative metrics like task success rate, user satisfaction score, and summary of user reviews. NPS alone doesnt cover theseareas.
No product tool or template can save you if you’re not killing it in these three areas. That’s why we’ve listed 12 tools that the best product managers use to do their jobs better? That’s why we’ve listed 12 tools that the best product managers use to do their jobs better?—?and and not the best product management tools.
Get to Know Your User (30 minutes) First things first – who are you solving for? This step is all about understanding who your user is. Example: Imagine you’re designing a new dashboard for a fintech app. ” Perhaps users are spending a lot of time on manual tasks. Here’s how it breaks down: 1.
By placing the product at the center of the growth strategy, PLG drives customer acquisition, conversion, and retention through exceptional product experiences. This article explores the core principles of PLG, its benefits and challenges, and provides real-world examples to inspire new ideas and insights.
If you don’t know exactly what questions you want answered, these product metrics leave you blinded by the very data you hoped would open your eyes. Product metrics are data measurements that businesses use to evaluate the success of a product and determine how customers are engaging with it. What are product metrics?
We organize all of the trending information in your field so you don't have to. Join 96,000+ users and stay up to date on the latest articles your peers are reading.
You know about us, now we want to get to know you!
Let's personalize your content
Let's get even more personalized
We recognize your account from another site in our network, please click 'Send Email' below to continue with verifying your account and setting a password.


Let's personalize your content