This site uses cookies to improve your experience. To help us insure we adhere to various privacy regulations, please select your country/region of residence. If you do not select a country, we will assume you are from the United States. Select your Cookie Settings or view our Privacy Policy and Terms of Use.
Cookie Settings
Cookies and similar technologies are used on this website for proper function of the website, for tracking performance analytics and for marketing purposes. We and some of our third-party providers may use cookie data for various purposes. Please review the cookie settings below and choose your preference.
Used for the proper function of the website
Used for monitoring website traffic and interactions
Cookie Settings
Cookies and similar technologies are used on this website for proper function of the website, for tracking performance analytics and for marketing purposes. We and some of our third-party providers may use cookie data for various purposes. Please review the cookie settings below and choose your preference.
Strictly Necessary: Used for the proper function of the website
Performance/Analytics: Used for monitoring website traffic and interactions
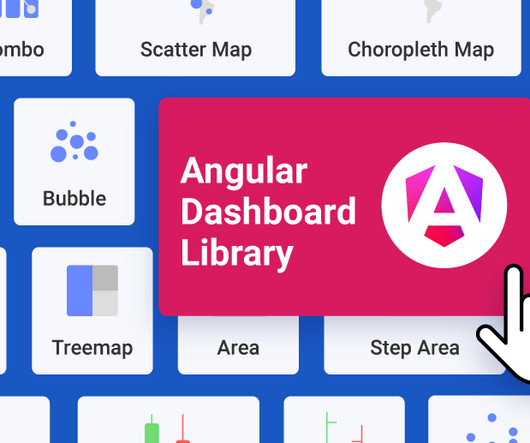
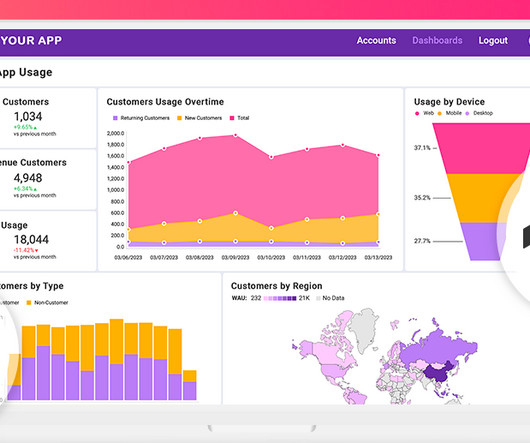
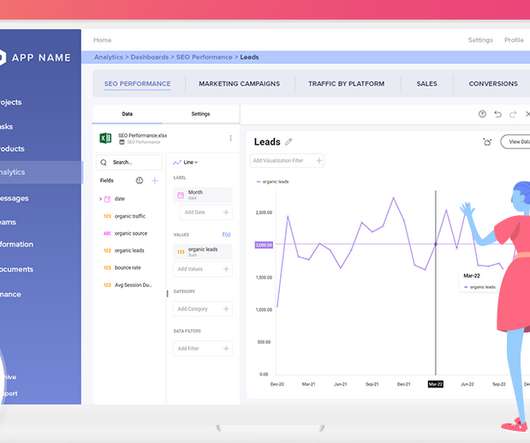
Reveal Embedded Analytics We know how difficult it is to create dashboards, especially for web applications. However, running business operations or targeted campaigns without insights into their effectiveness is not an option. Thats what dashboards are for. What is an Angular Dashboard Library? Dont worry.
Five years ago, including embedded analytics in an application was a powerful way for product teams to differentiate their applications, reduce customer churn, and charge more for their products. When considering the value of analytics relative to their products overall, survey respondents estimated the value at 54%, up from 45% in 2016.
We’ve researched, tested, and curated a list of 10 top-rated session recording tools to help you unlock valuable user insights and build better digital experiences. Microsoft Clarity – Suitable for SMBs with no heavy analytics needs – 100% free. This article aims to simplify the decision-making process.
Starting a career as a businessintelligence analyst requires understanding the key steps, skills, and experiences needed for success. In this article, we will outline the typical journey for businessintelligence analysts, covering educational requirements, entry-level positions, potential advancements, and long-term opportunities.
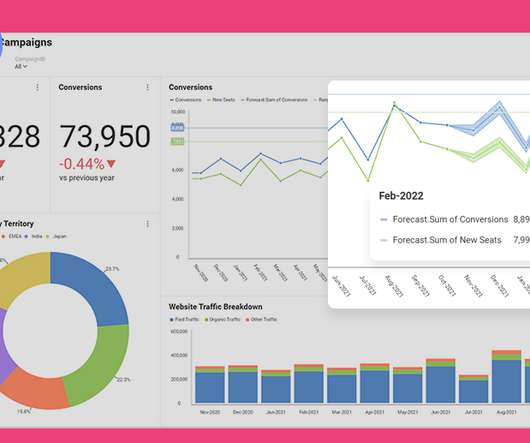
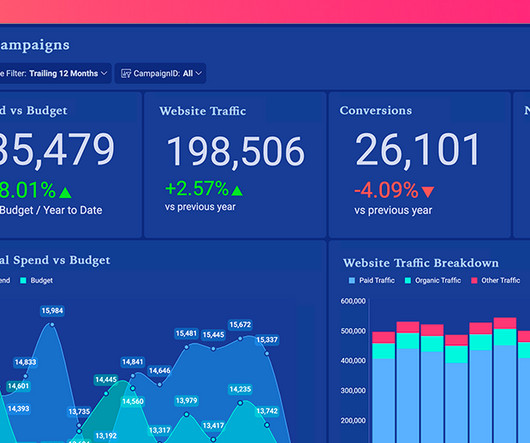
Think your customers will pay more for datavisualizations in your application? But today, dashboards and visualizations have become table stakes. Discover which features will differentiate your application and maximize the ROI of your embedded analytics. Brought to you by Logi Analytics.
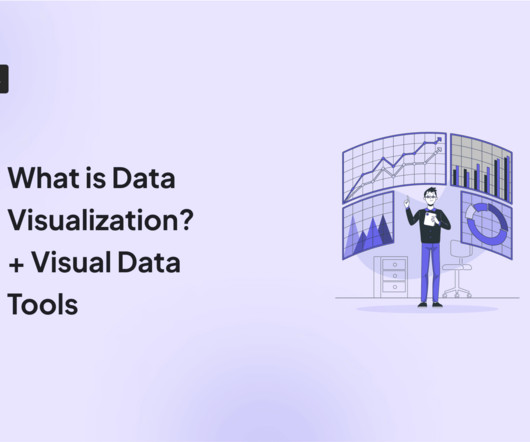
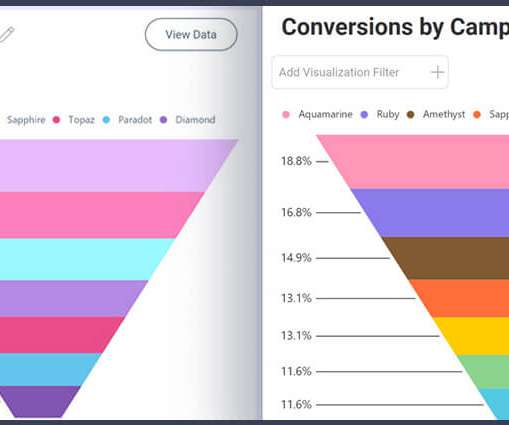
Visualdata surrounds us – colorful charts on weather reports, infographics on the web and in social media articles, map charts in presentations, etc. To help you get started with datavisualization, this article explores various visualization methods and their use cases. Funnel charts. Pie charts.
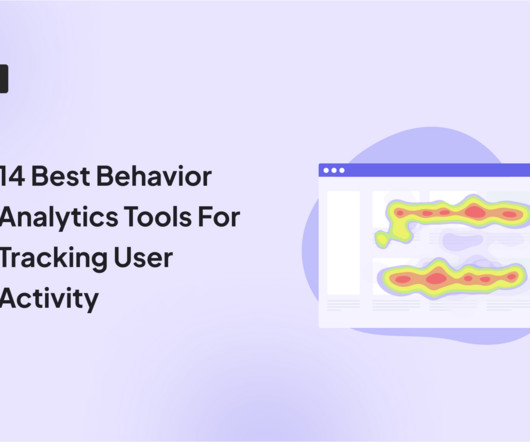
By analyzing user behavior patterns and uncovering valuable insights, behavior analyticstools enable businesses to design strategies that drive retention and business growth. Discover the cutting-edge of behavioral analyticstools! There are different types of behavioral analyticstools used in SaaS.
Reveal Embedded Analytics Introduction to Embedded Analytics in Angular and.NET Core Embedded analytics is no longer an optional featureits a necessity for modern applications. In 2025, users demand seamless access to real-time insights directly within the tools they use daily. Why is Embedded Analytics Essential?
Every company, of every size — even organizations of just one person — are navigating a data avalanche problem. Every team — from product to marketing, and IT to engineering — is generating data. A strong analytics stack is foundational to being able to make sense of it all. Data Tracking and Collection. Event Data.
Reveal Embedded Analytics. Embedded analytics is everywhere around us – in our cars, in our homes, in our security systems, in the digital advertising that we see while surfing the web, and even in the healthcare services we are being treated with. And that is because data nowadays is everything. Especially in business.
Google Analytics as Your Default Platform? As a product manager, the impact of your business decisions will be measured by your product’s front-end data. It is your obligation to be able to implement an analytic platform, analyze the data and present your findings. Visualization. In-app Services.
In fact, the 2024 Buyer Experience Report by 6sense found that a whopping 85% of buyers establish purchase requirements before even contacting sales. Step 2: Collect internal assets Once you’ve decided on your use case, it’s time to dig into your internal assets to gather crucial customer data. moments along your customer journey.
Look for unique applications of the tools you already have. This approach can reveal unexpected insights and user preferences, helping you shape the final product. Listen now on Apple , Spotify , and YouTube. Raiza previously worked on AI Test Kitchen and has a background in startups, payments, and ads.
Today, Constellation Research , a leading technology research and advisory firm based in Silicon Valley, announced that Birst, an Infor company, for the fourth consecutive time, has been named to the Constellation ShortList for Cloud-Based BusinessIntelligence and Analytics Platforms.
Reveal Embedded Analytics. It’s hard to believe that many organizations in today’s data-driven world are still struggling to make use of the vast amounts of data they possess and that for most, accessing and analyzing data remains a distant goal. The Do’s of Embedding Analytics Into Your Apps.
I did classic web development before there were frameworks back in the ’90s. This definition is a mouthful, so I like to visualize it. I’m going to walk through this visual quickly, and then Cecilie and I are going to dive into this in more depth. A core part of this is this visual.
Reveal Embedded Analytics. Businesses of all industries and all sizes incorporate embedded analytics technologies and capabilities into their own software, SaaS platforms, Angular apps , or other apps because of the tremendous benefits that they get. Crypto: Leverage the most suitable market conditions and invest intelligently.
Reveal Embedded Analytics With abundant data, users have shifted to a data-first approach to guide their decision-making process. Integrating powerful BI with fully interactive visuals and reports into your Blazor applications makes dataanalytics accessible to all your end-users.
No product tool or template can save you if you’re not killing it in these three areas. That’s why we’ve listed 12 tools that the best product managers use to do their jobs better? That’s why we’ve listed 12 tools that the best product managers use to do their jobs better?—?and and not the best product management tools.
Reveal Embedded Analytics In today’s data-driven world, integrating dashboards and analytics capabilities directly within SaaS applications is a must. There are many benefits to embedding analytics , including quicker time to market, increased productivity and performance, and growth of profits.
What’s digital analytics? How can it help product and marketing teams make data-driven decisions and improve the user experience at different stages of the customer journey? TL;DR Digital analytics allows teams to measure and analyze product performance to improve their digital strategy. This could be website data (e.g.,
Mixpanel launched over a decade ago as an analyticstool for product teams. That makes it important to use the same analyticstool. Traditional marketing analyticstools were built for just the web, but marketing channels have evolved. There are two reasons why.
Reveal Embedded Analytics. Choosing the right embedded analytics solution to partner with is crucial. Nowadays, it is quite evident that businesses’ success heavily relies on datainsights that embedded analytics software can provide them with. Table of contents: What is Power BI embedded?
Reveal Embedded Analytics. Among all embedded analytics products on the market, Tableau is certainly one of the most popular BItools for analyzing, visualizing, and working with data. Tableau has been helping businesses to transform raw data into valuable insights for more than 16 years.
Embarking on a career as a businessintelligence analyst involves a combination of education, skills development, and practical experience. This guide will provide you with a comprehensive overview of the path to becoming a successful businessintelligence analyst. Let’s dive in!
What is DataVisualization? More than just making numbers look pretty, datavisualization is the graphical representation of information. Graphs, charts, maps, and tables are powerful communication tools, helping to make data more accessible. Why is DataVisualization important for Product Managers?
Whether you’re looking to deepen your expertise, stay updated with industry trends, or find practical tools to enhance your workflow, the right resources are essential for continuous growth and success. Looking to leverage product data for insights? Consider Userpilot for its engagement features and analytics capabilities.
Reveal Embedded Analytics. Logi Analytics is one of the first white-labeled/OEM embedded analytics providers for small-to-medium-sized businesses. But is Logi Analytics the right embedded analytics solution for your organization? Logi Analytics Overview. The Pros of Logi Analytics.
We know it can be daunting to pick just one tool, that’s why we’ve created this listicle and compared 10 top tools and their features side by side, helping you make a faster decision. TL;DR Customer success software refers to tools that help manage customer experiences and drive customers toward their desired outcomes.
According to Userpilot’s SaaS Product Success Metrics Benchmark report , Fintech and Insurance companies had the second-lowest activation and adoption rates of all industries. This is because the client onboarding process in financial services faces unique challenges. What are they? Let’s get started.
Without retention, a SaaS business doesn’t have a predictable revenue stream necessary for growth. Retention makes businesses more profitable by reducing the CAC and making account expansion easier. Create comprehensive self-service resources to enable users to solve problems independently. The solution?
Key Tasks User issues reports. Identify key quality metrics and create dashboards to track real-time product health. Bug Service Level Agreement (SLA). Identify measures of success, create dashboards for tracking, and report on progress to ensure team’s know whether or not they’re hitting the mark. Bug triage.
Let’s face it: qualitative data analysis is vital to understanding why users act in a particular way and how they feel about your product in a way that quantitative product analytics can’t. This article will teach you how to analyze qualitative data to inform product development and improve the product experience.
Reveal Embedded Analytics. Embedding analytics into your Angular apps is a tremendous advantage for your business; it helps you gain valuable businessinsights from your data and grow your profits by guiding key business decisions. What Is BI? Why Should Your EmbedBI in Your Angular Apps?
Reveal Embedded Analytics Integration is the most important thing to consider when choosing an embedded analytics vendor to partner with. When analytics into an existing application, the user experience, workflows, and branding must flow seamlessly without adding complexity or confusion to your customers.
Reveal Embedded Analytics. Looking for an alternative to Sisense embedded analytics platform? Reveal has been rated as one of the highest performing embedded analytics solutions on the market based on customer satisfaction ratings. That being said, Sisense does a great job if you’re analyzing large data sets.
Reveal Embedded Analytics Reveal is an industry-leading embedded analytics solution that aims to provide ease of use for integrating powerful analytics capabilities into applications. Making Reveal accessible to all types of business users, regardless of their experience and expertise, has always been our priority.
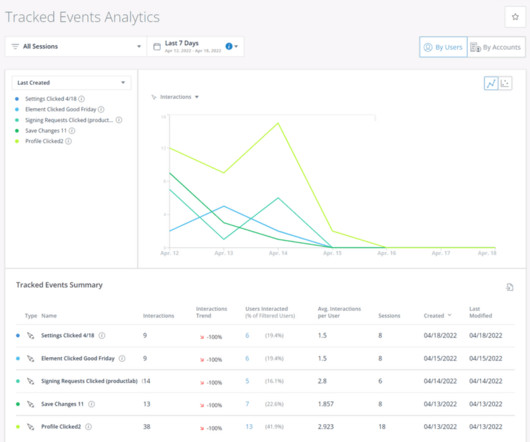
How does it compare to other similar tools? WalkMe supports analytics features such as Tracked Events, Session Streams, User Recordings, and AI Predictive Analysis to gain actionable insights into user in-app behavior. WalkMe Surveys allow you to collect customer feedback , including NPS data. What is WalkMe?
Todays Fintech disruptors and neobanks are igniting our brains reward centers with flashy visuals, gamified challenges and social interactivity that practically beg us to keep coming back for more. It ultimately changes how we think about financial services. Today, clients expect more than a basic straightforward financial service.
Heatmaps revolutionized product analytics when they first came to the scene. But product teams have much more advanced analytics at their disposal. Now, heatmap alternatives offer greater insight into user behavior and preferences. This article shows you six of the best tools to use. But heatmaps also have limitations.
Reveal Embedded Analytics. As a business owner or manager, it’s natural to want your business to run smoothly and efficiently. When it comes to embedded analytics a lot of business owners and managers use white labeling software that helps them build trustful and loyal relationships with their valuable customers.
Reveal Embedded Analytics. Collecting data is easy, yet interpreting that same data is difficult. This is where tools such as Reveal and Looker come in handy – they convert raw data into easy-to-understand and easy-to-use insights that enable organizations to reshape and modernize the way they do business.
Let’s look at some of the tools you can use to create the best feedback button for your website and application. That’s why it becomes important to rely on a tool like a web feedback widget to know and understand your customers better. collect voice of customer data – and use it in your marketing copy.
Today’s SaaS market is highly competitive, and in this industry with a lot of similar products and prices, superior customer service makes all the difference. There is much work to be done, from recruiting and training support agents, to purchasing expensive tools and working shifts. AI tools are a must in customer service.
We organize all of the trending information in your field so you don't have to. Join 96,000+ users and stay up to date on the latest articles your peers are reading.
You know about us, now we want to get to know you!
Let's personalize your content
Let's get even more personalized
We recognize your account from another site in our network, please click 'Send Email' below to continue with verifying your account and setting a password.


Let's personalize your content