This site uses cookies to improve your experience. To help us insure we adhere to various privacy regulations, please select your country/region of residence. If you do not select a country, we will assume you are from the United States. Select your Cookie Settings or view our Privacy Policy and Terms of Use.
Cookie Settings
Cookies and similar technologies are used on this website for proper function of the website, for tracking performance analytics and for marketing purposes. We and some of our third-party providers may use cookie data for various purposes. Please review the cookie settings below and choose your preference.
Used for the proper function of the website
Used for monitoring website traffic and interactions
Cookie Settings
Cookies and similar technologies are used on this website for proper function of the website, for tracking performance analytics and for marketing purposes. We and some of our third-party providers may use cookie data for various purposes. Please review the cookie settings below and choose your preference.
Strictly Necessary: Used for the proper function of the website
Performance/Analytics: Used for monitoring website traffic and interactions
Without effective UX analytics that goes beyond collecting data, you’re losing valuable customers. Unfortunately, the research backs this up, with a staggering 90% of users reporting that they stopped using an app due to poor performance. It covers key topics, such as: Defining UX analytics. What is UX analytics?
Using a custom ChatGPT model combined with collaborative team workshops, product teams can rapidly move from initial customer insights to validated prototypes while incorporating strategic foresight and market analysis. Instead of focusing solely on today’s customer problems, product teams need to look 2-5 years into the future.
When your company adopts multiple SaaS solutions to drive productivity, you unknowingly create a perfect storm for data fragmentation. Your customer information lives in Salesforce, while your support tickets are in Zendesk, your product usage data in Mixpanel, and your marketing campaigns in HubSpot. Sound familiar?
You know your product collects tons of data. Datavisualizationtools help turn your messy spreadsheets into clear, interactive insights. The best ones dont even need SQL or data science skills. Because product analytics should be easy and accessible for everyone, not just data experts.
But many companies fail to achieve this goal because they struggle to provide the reporting and analytics users have come to expect. The Definitive Guide to Embedded Analytics is designed to answer any and all questions you have about the topic.
Proactive Problem Solving Doug was motivated to write Proactive Problem Solving by two pieces of data showing the impact of reactive problem solving: The average manager wastes 3.5 Its first section focuses on problem definition, clearly stating what the problem is and why solving it matters. hours every day dealing with problems.
The discussion reveals how product management has evolved since 1931 and highlights the importance of clear role definition to prevent job frustration. He emphasizes that these activities vary based on context (large vs. small organizations, B2B vs. B2C, Agile vs. Waterfall).
How product managers are transforming innovation with AI tools Watch on YouTube TLDR In this deep dive into AI’s impact on product innovation and management, former PayPal Senior Director of Innovation Mike Todasco shares insights on how AI tools are revolutionizing product development.
Think about all the insights you could gather to improve the user experience. By showing how users interact with different elements on the page or product screen, session replays provide product teams , designers, and marketers with valuable insights into user behavior. Every click, scroll, hover, or keystroke?
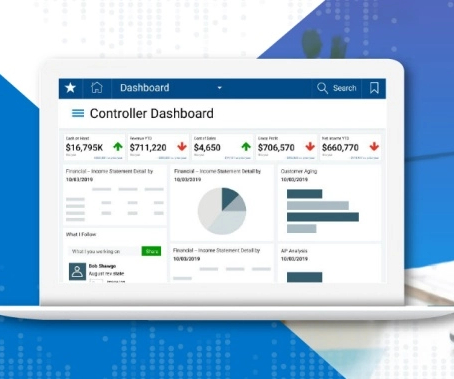
Dashboard design can mean the difference between users excitedly embracing your product or ignoring it altogether. Great dashboards lead to richer user experiences and significant return on investment (ROI), while poorly designed dashboards distract users, suppress adoption, and can even tarnish your project or brand.
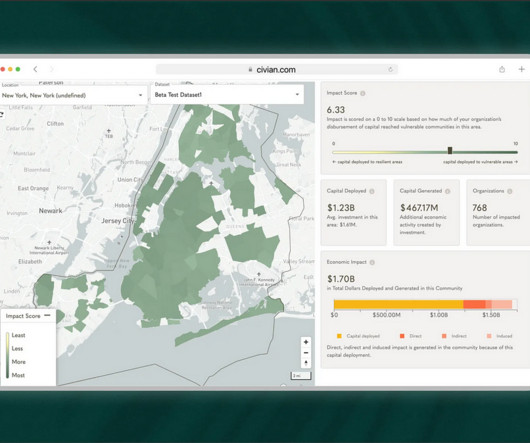
Case Study: Improving Data-Driven Decision Making for CSR Leadership Civian is a data-driven platform designed to help businesses measure, optimize, and showcase the social and economic impact of their investments in communities. Feature Engagement Users most frequently gravitated toward the map to explore and compare data.
It requires meaningful collaboration between researchers and data scientists. It requires thought and intentionality around how we store, handle, interpret, and leverage vast quantities of qualitative and quantitative data. And it requires answering the right questions using insights and evidence.
If youre looking for AI tools that will help you make your work more efficient, you come to the right place. This collection of AI tools will be very helpful for all product designers. Claude Category: Versatile chatbot If youre using ChatGPT daily, you should definitely tryClaude. components using Tailwind CSS.
A self-servicedata platform is the backbone of informed decision-making and a growing SaaS business. But how do you choose the right data platform for product analytics ? Let’s go over what a data platform is, its importance, and the must-have features you should consider to choose the right platform for you.
Predictiveanalytics is an increasingly common buzzword with many forms. What does predictiveanalytics really mean? We’ll explore real-world examples of predictive in action and outline steps to help you maximize its value. Why every application that fails to talk about the future is at risk of getting replaced.
A customer sentiment dashboard is a great way to visualize customer feedback and see what users love (or hate) about your product. But how do you collect the right data for your analysis? This article shows you a step-by-step process and some of the best tools to use. Track customer behavior for experience insights.
In SaaS, a customer onboarding dashboard can become a massive product analyticstool to understand and optimize the user journey. But what type of dashboards can you use to analyze your onboarding process? Let’s explore how a customer onboarding dashboard works and see different examples.
Or rather, two – conversation topics and custom reports. Well, my panel today are no strangers to asking that same question in conversations they have with each other, as they have been instrumental in our recent release of custom reports and conversation topics. Opening new possibilities with custom reports. Rati: Definitely.
Questions about production: We wanted our definition to be wide, generic, and representative of the broad scope of workflows we cater for. No tool will give you answers, only offer leads you can follow to find the real answers. Until recently, our observability tooling has been primarily based on metrics. Why traces?
Are you thinking of adding enhanced data matching and relationship detection to your product or service? This guide provides many valuable insights. Do you need to know more about what to look for when assessing your options? You’ll learn about use cases, technology and deployment options, top ten evaluation criteria and more.
How product managers can use visual storytelling to make their ideas stand out. Using visuals to help communicate information can be very helpful. Visualtools can make information easy to understand and also place it in context. When it comes to visual information, Amy Balliett is a leader.
I hate definition wars. This definition is a mouthful, so I like to visualize it. I’m going to walk through this visual quickly, and then Cecilie and I are going to dive into this in more depth. A core part of this is this visual. I can break this visual down into 11 habits. It’s that simple.
We started in episode 307 with an introduction to the body of knowledge, explored strategy in episode 309, portfolio management in 311, development process in 313, and now we are discussing Design & Development Tools. These are tools that are used in a product process to move from idea to market-ready product.
That said, it’s still a pretty powerful feature for web teams who want to find qualitative insights with quantitative data. Plus, before you ask, Mixpanel does include customer data masking by default to keep sensitive user info hidden (it’s always a win to stay GDPR-compliant). Automatic bug reporting (which Mixpanel lacks).
Speaker: Miles Robinson, Technical Project Manager, iFixIt
How to frame the data to help make that decision can be done by instinct, or it can be done SMART: Specific definition of the project scope and completion. When adding projects to a roadmap, the question of outsourcing or doing work “in house” is always a consideration. Alignment with your purpose and vision.
In SaaS, a new user activation dashboard can become a massive product analyticstool to understand and optimize the user journey. But how can a dashboard for user activation can help you engage more users? moment ," where the core value proposition of your service becomes clear and tangible.
If 2020 has taught us anything, it’s that predicting the future is hard and in this episode, sponsored by Amplitude, we turn to Margaret Heffernan to learn how to do it better. The post Making Better Predictions – Margaret Heffernan on The Product Experience appeared first on Mind the Product. Using data sensibly.
You can get the answers you need simply from product management analyticstools. To help you know which tool to use, this article will cover the ten best product analyticstools. TL;DR Product analyticstools analyze user interaction, preferences, and engagement with a product.
To gather the information needed to avoid this, quantitative data is a valuable tool for all startups. This article will examine quantitative data, the difference between quantitative and qualitative data, and how to collect the former. It is often shown in bar or pie charts.
Is your in-app guidance strategy based on hard data? In-app guides are powerful tools for delivering exceptional product experiences, but it’s all too easy to use them improperly, or get a little carried away. Or are you just going with your best guess? Are you delivering the right messages to the right people at the right time?
However, even when product trios commit to weekly interviews with customers, their companies may have other avenues for collecting customer feedback and insights. And the company might even have analyticstools or surveys in place to monitor customer behavior and collect feedback directly from customers. When will they need it?
Marketing leader, Justin Norris shares recommendations for how to produce valuable reporting for stakeholders. Let’s say in this case, the digital product is a report. When a stakeholder requests a report, whether they tell you this or not, they made the request so they can get something done. Understand the business problem.
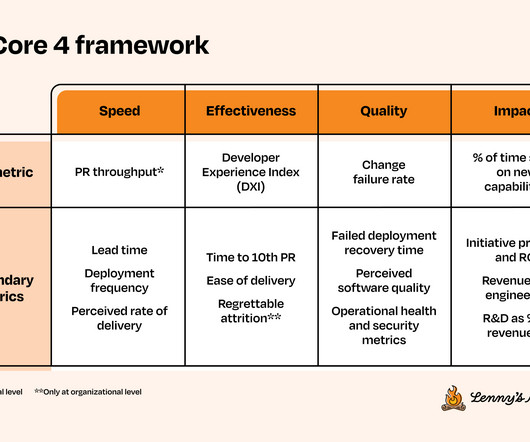
Her background is in developer tools and distributed systems. The SPACE framework of developer productivity offers a robust definition of developer productivity covering five dimensions: satisfaction and well-being, performance, activity, communication and collaboration, and efficiency and flow. See the example in the template.
If there is one thing thats altering the way we create user experience (UX) designs and conduct research in 2024, it is definitely artificial intelligence (AI). Well start with an overview and explore how AI can take on tasks such as analyzing user data and automated prototyping to help professionals connect with users on a humanlevel.
of respondents said they’d identified opportunities in their last interview because I find most teams aren’t clear on the definition of “opportunity.” Interview snapshots are a way to visually synthesize what you are learning from each interview. It’s not a solution or feature request. of respondents).
Automated customer service isn’t a new concept. Here’s an inside look at how we’ve implemented personalized, automated customer service at Intercom, and ideas about how to successfully implement automation as part of your own support offerings in the future. What is automated customer service? Why automate your customer service?
Primarily there are 3 major aspects to understanding and performing well as a Product Manager, which are as listed below: Understanding the Role Definition Hard Skills required for the Role Soft Skills required for the Role. Understanding the Role Definition. Definition of PM role. Data vs Intuition. Product Strategy.
Instead, we must go back to the age-old mantra that a picture is worth a thousand words and provide a visual representation of what the future could look like if we are successful. Design: Customer Discovery Insights. Whenever you are surprised it means you've collected a valuable insight. Design: Product Roadmap.
If you don’t know exactly what questions you want answered, these product metrics leave you blinded by the very data you hoped would open your eyes. Product metrics are data measurements that businesses use to evaluate the success of a product and determine how customers are engaging with it. What are product metrics?
There are so many multivariate testing tools available that it can be difficult to choose the right one. Whether you’re a seasoned marketer or a budding entrepreneur, this comprehensive guide will equip you with the knowledge and resources to elevate your product analytics and optimization efforts. Let’s dive in!
Definition of the Voice of the Customer (VoC). It’s become a standard business term used to describe the process of collecting data about customer expectations, preferences, and dislikes. It’s become a standard business term used to describe the process of collecting data about customer expectations, preferences, and dislikes.
Everyone talks about getting insights from digital products and processes, yet I’ve seen it done wrong so many times that the subject demands revisiting, especially in light of the emerging field of DataOps. Data is increasingly complex and complexity can only be managed via stable and reliable foundations. What is an Insight?
To deliver high-quality online courses we were patching together several different tools to create a good student experience. At the heart of all of my administrative troubles was the need to move data in between disparate systems and to make sure that all of these systems were in sync. It was our primary tool.
TL;DR Vanity metrics appear impressive but don’t provide actionable insights or inform future strategies. Gather data from various sources (e.g., web analytics, in-app surveys , product analytics). For example, if your web traffic data doesn’t help you improve your content strategy, it’s a vanity metric.
We organize all of the trending information in your field so you don't have to. Join 96,000+ users and stay up to date on the latest articles your peers are reading.
You know about us, now we want to get to know you!
Let's personalize your content
Let's get even more personalized
We recognize your account from another site in our network, please click 'Send Email' below to continue with verifying your account and setting a password.


Let's personalize your content