This site uses cookies to improve your experience. To help us insure we adhere to various privacy regulations, please select your country/region of residence. If you do not select a country, we will assume you are from the United States. Select your Cookie Settings or view our Privacy Policy and Terms of Use.
Cookie Settings
Cookies and similar technologies are used on this website for proper function of the website, for tracking performance analytics and for marketing purposes. We and some of our third-party providers may use cookie data for various purposes. Please review the cookie settings below and choose your preference.
Used for the proper function of the website
Used for monitoring website traffic and interactions
Cookie Settings
Cookies and similar technologies are used on this website for proper function of the website, for tracking performance analytics and for marketing purposes. We and some of our third-party providers may use cookie data for various purposes. Please review the cookie settings below and choose your preference.
Strictly Necessary: Used for the proper function of the website
Performance/Analytics: Used for monitoring website traffic and interactions
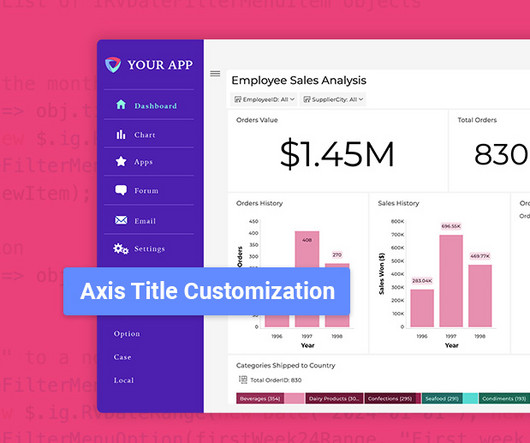
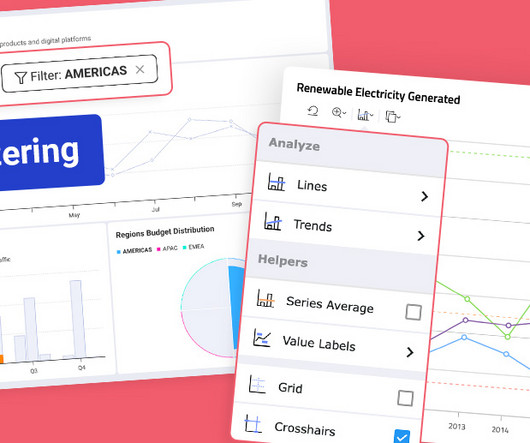
Fixed Lines for Charts: Set static reference points to highlight key data trends. Flexible Chart Legend Positioning: Move and align legends for better dashboard design. Fixed Lines: Set Key Benchmarks in Charts Static Reference Points: Easily highlight important thresholds for better comparisons.
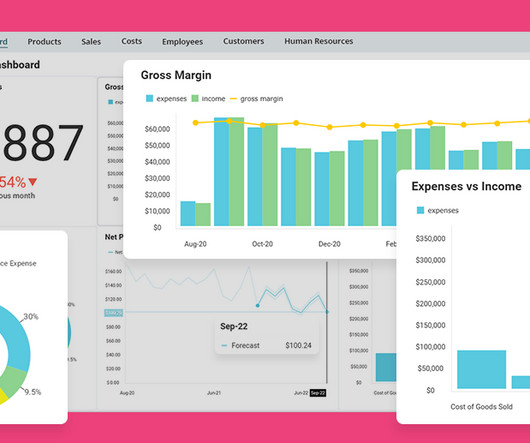
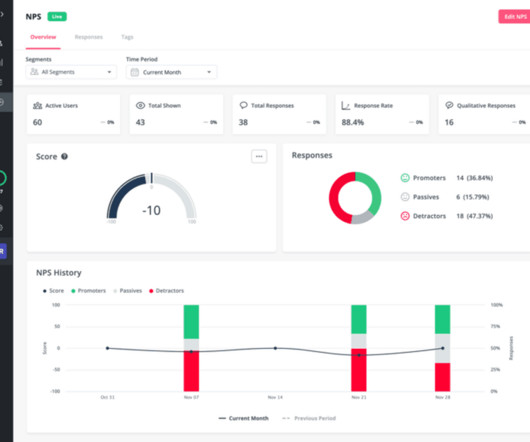
A customer sentiment dashboard is a great way to visualize customer feedback and see what users love (or hate) about your product. TL;DR A sentiment analysis dashboard typically integrates information from multiple data sources, such as social media posts, customer reviews, survey responses , and customer service chats.
Unfortunately, the research backs this up, with a staggering 90% of users reporting that they stopped using an app due to poor performance. Basically, anything that ruins the userexperience. UX analytics involves gathering, analyzing, and interpreting data about how users interact with your product or service.
Choose UX research tools with essential features , collaboration, reliable support , user-friendliness, scalability , integrations , and strong security. Userpilot enhances userexperience through in-depth UX research, offering features to gather, analyze, and act on customer feedback.
Alongside usability testing, userexperience interface guidelines allow you to build more intuitive and user-friendly solutions. In this blog, we explain eleven userexperience and interaction design guidelines supported by real-life examples to improve product engagement. System status visibility.
Usability vs userexperience – what’s the difference? As a UX designer , you aim to create app designs that facilitate the best experience. While the terms usability and userexperience are used interchangeably, it’s important to know that there’s a difference between the two.
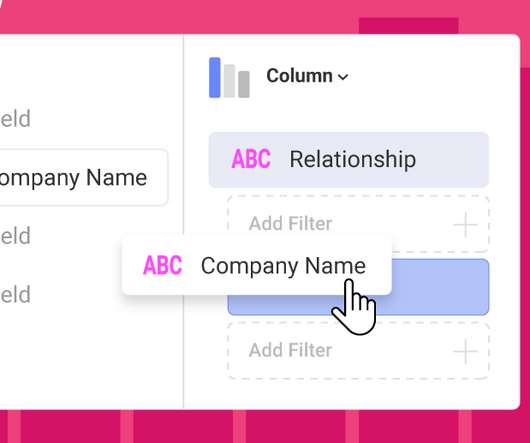
One of these features you should look for is dashboard linking. The following article will delve into dashboard linking, its advantages, and potential benefits across various industries. What Is Dashboard Linking? In embedded analytics , dashboard linking refers to the ability to connect and navigate between multiple dashboards.
One of these features you should look for is dashboard linking. The following article will delve into dashboard linking, its advantages, and potential benefits across various industries. What Is Dashboard Linking? In embedded analytics , dashboard linking refers to the ability to connect and navigate between multiple dashboards.
Tighter feedback loops and faster improvements to userexperience. Privacy settings to mask sensitive data Fullstory’s privacy settings allow you to protect user information by masking sensitive data like credit card numbers, passwords, and personally identifiable information within session replays. Custom dashboards.
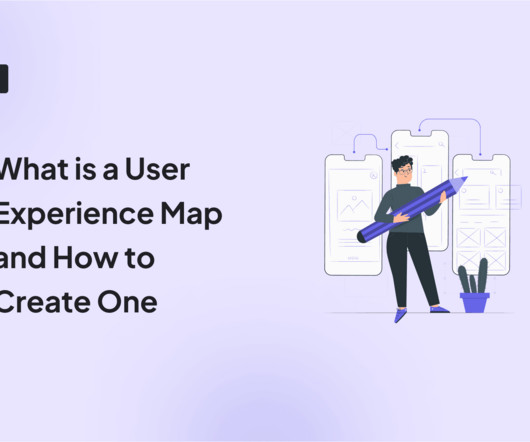
The solution might lie in your ability to create a comprehensive userexperience map. A well-crafted userexperience map can be your secret weapon for understanding customers, identifying pain points, and boosting product engagement. We also identify some best practices to follow when creating the userexperience map.
Conversely, if the userexperience heavily relies on a graphic user interface, the larger the gap for the product designer toaddress. This phenomenon is referred to in Soft Systems Methodology (SSM) as worldviews. (1) Knowledge gaps create a mutual dependency that can only be resolved throughtrust.
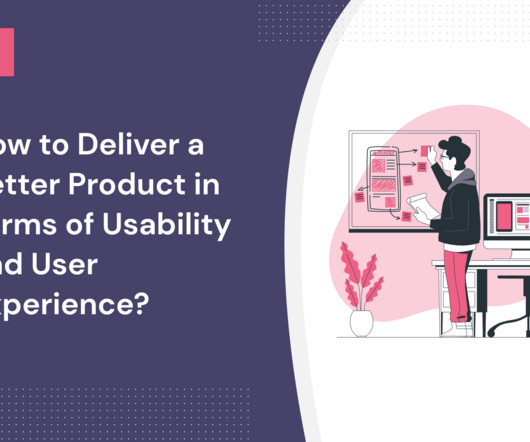
If you’re a UX designer or product manager wondering how to deliver a better product in terms of usability and userexperience, this is the article for you. Start improving userexperience and usability with user research. How do usability and userexperience differ? Let’s get right to it!
1 Engagement DAU/MAU Understand daily and monthly active user engagement and overall app popularity. 2 Engagement Feature adoption Gauge user interest in new features and optimize feature development. 3 Engagement Average user session length Measure user interactions and identify areas for improved content or flow.
Session replay tools for mid-market and enterprises Now, without wasting more time, lets explore the best session replay tools for mid-market and enterprise users: Userpilot Best for : Mid-market and enterprises prioritizing userexperience and in-app guidance. Userpilot is like a Swiss army knife for improving userexperiences.
You will also detect crucial friction that hinders the userexperience while analyzing numerous customer touchpoints. You can collect consumer insights by gathering passive and active user feedback. Passive feedback refers to watching and learning user behavior without engaging with customers directly (i.e.,
This data makes it easier to optimize product features and improve them to better the userexperience. Ultimately, growth engineering enables SaaS companies to iterate quickly, experiment with possible new solutions, and implement major or minor userexperience improvements. Growth hacking vs. growth engineering.
You can also use them to collect qualitative data , just like in user interviews. Feature flagging is a practice of disabling UI elements to see how they impact userexperience. Userpilot allows you to track product usage, visualize feature engagement with heatmaps and collect user data. User interviews.
This updated toolbar enhances userexperience by offering advanced data analysis and interactive features. Chart % Based Filtering [Beta] Chart % Based Filtering in Reveal enhances your dashboard’s interactivity by allowing percentage-based interactions across various visualizations.
Understanding Embedded Analytics Embedded analytics refers to the integration of data visualization and business intelligence (BI) tools directly into software applications. Unlike standalone BI solutions, embedded analytics allows users to access insights in context without switching between platforms. Congratulations!
That led me down one final rabbit hole, but a very useful one, as I soon realized that Framework was a perfect fit for one of my fractional CTO client’s “data science reporting and dashboard” needs. The non-profit’s primary user-facing (farmer-facing!) The majority of their team are data scientists.
So let’s see how you can collect customer feedback for analysis and understand user sentiment to improve the userexperience. TL;DR Survey analytics is the process of interpreting user feedback from surveys to gain actionable insights and identify improvement opportunities. What is survey analytics?
They combine quantitative and qualitative data to help businesses understand the big picture of their userexperience. As the name implies, FullStory auto logs all aspects of users’ interactions such as scroll, swipe, click, and pageview. The dashboard’s widget wizard contains a library of pre-configured dashboards.
Regularly collect and act on customer feedback to improve the userexperience. Create a customer retention analytics dashboard to measure success across key metrics. In SaaS, customer retention is a stage in the customer journey when the user has adopted the product and continues using it. The result? The solution?
Drag and drop analytics are interactive and user-friendly analytics platforms that allow users to analyze complex data sets and build custom dashboards and reports by themselves when they need them. . Let’s you build custom dashboards and reports in minutes. What Is Drag and Drop Analytics? See Reveal in Action.
Understanding how end-users interact with your product is crucial to identifying userexperience bottlenecks. It also helps identify better ways to engage users. When combined with product analytics , end-user behavior monitoring can help you boost product usage and retention rates. Book a demo now to get started.
Wondering how to properly measure userexperience and what metrics to track? Let’s explore what the userexperience is, the types of metrics you can use, and how to measure them to improve product engagement. The userexperience involves every feeling, process, and result that a user gets when interacting with a product.
It lacks other analytics reports such as cohort retention reports, path analysis, and custom dashboards. out of 5 stars Pricing: Growth plan at $799/month Supported devices: Web for the time being and mobile coming in 2025 Userpilot is a product growth platform that helps companies increase adoption, user satisfaction, and retention.
Tracking feature usage provides insights that help you prioritize product development, enhance the userexperience , improve engagement , and drive retention. The feature usage rate is the total number of users who have used a feature divided by the total number of product users, multiplied by 100. What is feature usage?
Best practices for a successful push notification strategy Now, before you start sending push notifications all over, keep in mind these best practices: Personalize push notifications to encourage user interaction Generic notifications are easy to ignore. But personalized messages make users react as if youre speaking directly to them.
TL;DR User behavior patterns refer to the common behaviors people demonstrate while using an app. Behavioral analysis aims to identify these trends to improve the userexperience. Monitoring patterns in user behavior offers several benefits, including improved product adoption and reduced churn.
Product analytics tools : Platforms that allow you to track and analyze user interactions within a product to help you optimize the userexperience and improve product performance. If you’re short on time, refer to the summary table below: Tool name Best for… Free plan? Lookback Type : User testing tool.
UXtweak is the best free userexperience research platform. Userpilot is the product growth platform for user journey analytics. Integrations refer to the free exchange of information between applications inside a system. UXtweak helps enhance impact by testing how users interact with your webpage in 5 seconds.
Your retention rate is the percentage of customers who stick around at the end of a subscription cycle or term by renewing their contract, while churn refers to the percentage of customers who do not stick around; the percentage of customers who cancel or simply don’t renew. Engagement Metrics Help you Solve for “Why?”. “A
In SaaS, user engagement is the measure of user activity inside the product over time, often expressed in terms of usage frequency and intensity. User engagement could also refer to the strategies that businesses use to drive user interactions with the product, such as in-app messages or emails.
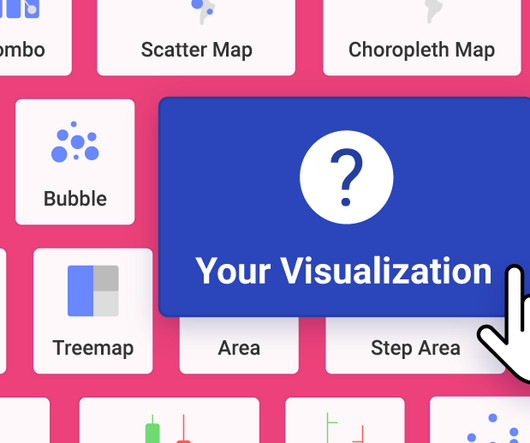
Enhanced UserExperience A well-designed custom visualization allows users to interact with the data more effectively, gaining deeper insights and a better understanding of the underlying information. With our innovative addition to the platform, you can now take control of the chart types available within your dashboards.
These tools help with improving retention, enhancing the userexperience , and making data-driven decisions. You can use them when monitoring in-app experiences, launching new features, and tracking campaign performances. When selecting a funnel tool, look for customization, integrations, segmentations , and dashboard options.
Photo by NordWood Themes on Unsplash Measuring userexperience (UX) has always been a complex challenge, requiring a blend of creativity and data-driven precision. TSR: Indicates how effectively users can achieve theirgoals. A single, actionable metric that encapsulates multiple dimensions of userexperience.
For example, Amazon and Netflix use predictive analytics to engage with their customers to offer better end to end userexperience. Deploying a model means the results predicted by the model are ready for it to be consumed by the users in everyday decision making process. Here is a reference of interest.
TL;DR In-app support in SaaS refers to the service features that customers can use to receive help directly within the product interface, besides connecting with your customer service team. Try Userpilot and Take Your Customer Experience to the Next Level Get a Demo 14 Day Trial No Credit Card Required What is in-app support in SaaS?
Want to know how the goals-signals-metrics process can be used to create a better userexperience? Let’s go over how you can effectively use the GSM process to improve your userexperience. Originated at Google, the goals-signals-metrics (GSM) process helps a product team create a smooth userexperience.
This allows you to optimize your roadmaps and make product improvements based on real user needs. Enhance userexperience : Positive customer experience is an easy way to stand out in a competitive landscape. The data from customer mapping enables you to deliver an improved userexperience.
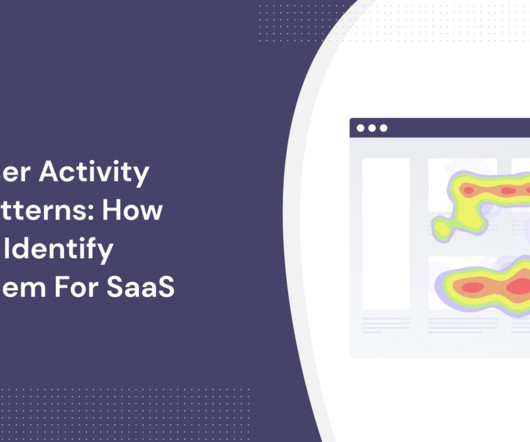
TL;DR User activity patterns are the trends and recurring behaviors users exhibit when interacting with a website or app. Activity patterns identify contexts in user behavior, helping you make informed decisions to improve userexperience. Benefits of tracking user behavior data : Understand current usage patterns.
TL;DR Digital adoption : Ensure users extract full value from your product features by measuring active users, feature usage, and product stickiness. Customer onboarding : Enhance the onboarding process using personalized experiences, checklists , and in-app guidance. Creating a CES survey with Userpilot.
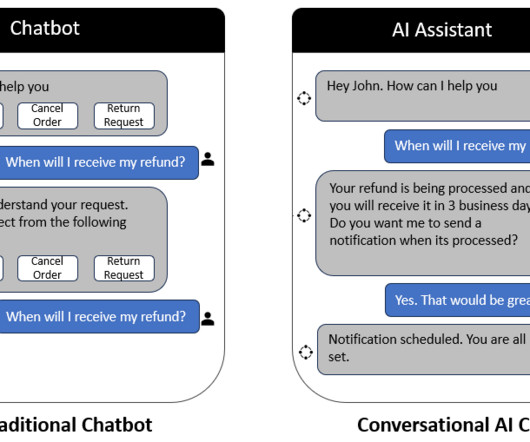
Banking on Conversation: The Future of UserExperience with Conversational UI Image created by the author using Bluewillow AI How many times do we all log in to our banking app and struggle to find information? Conversely, Conversational AI bots possess context awareness and are trained to comprehend user intent.
We organize all of the trending information in your field so you don't have to. Join 96,000+ users and stay up to date on the latest articles your peers are reading.
You know about us, now we want to get to know you!
Let's personalize your content
Let's get even more personalized
We recognize your account from another site in our network, please click 'Send Email' below to continue with verifying your account and setting a password.


Let's personalize your content