This site uses cookies to improve your experience. To help us insure we adhere to various privacy regulations, please select your country/region of residence. If you do not select a country, we will assume you are from the United States. Select your Cookie Settings or view our Privacy Policy and Terms of Use.
Cookie Settings
Cookies and similar technologies are used on this website for proper function of the website, for tracking performance analytics and for marketing purposes. We and some of our third-party providers may use cookie data for various purposes. Please review the cookie settings below and choose your preference.
Used for the proper function of the website
Used for monitoring website traffic and interactions
Cookie Settings
Cookies and similar technologies are used on this website for proper function of the website, for tracking performance analytics and for marketing purposes. We and some of our third-party providers may use cookie data for various purposes. Please review the cookie settings below and choose your preference.
Strictly Necessary: Used for the proper function of the website
Performance/Analytics: Used for monitoring website traffic and interactions
Reveal Embedded Analytics We know how difficult it is to create dashboards, especially for web applications. Thats what dashboards are for. In fact, Angular dashboards can provide key insights that will eventually allow data-driven decision-making at your company. It offers several options when it comes to dashboard libraries.
A customer sentiment dashboard is a great way to visualize customer feedback and see what users love (or hate) about your product. TL;DR A sentiment analysis dashboard typically integrates information from multiple data sources, such as social media posts, customer reviews, survey responses , and customer service chats.
With an abundance of product analytics to track, having a robust SaaS KPI dashboard is essential to monitor the metrics that matter most. This guide will walk you through what it is, why you need one, and how to build your very own dashboard. TL;DR A SaaS dashboard can be used to track important metrics and key performance indicators.
In SaaS, a new user activation dashboard can become a massive product analytics tool to understand and optimize the user journey. But how can a dashboard for user activation can help you engage more users? What is a new user activation dashboard? moment ," impacting user retention and satisfaction.
But today, dashboards and visualizations have become table stakes. Think your customers will pay more for data visualizations in your application? Five years ago they may have. Discover which features will differentiate your application and maximize the ROI of your embedded analytics. Brought to you by Logi Analytics.
Wondering how to build a customer success dashboard for your team? From the article, you will learn what a customer success dashboard is, why you need it, and what metrics it should include. And how to build a dashboard for your customer success team using Userpilot analytics ! Populate your dashboard with up to 30 reports.
Analytics dashboards are visualization tools that give you an overview of key metrics. In this article, we’ll discuss 10 analytics dashboard examples. It will give you a better understanding of the type of metrics to monitor in your dashboard and help you draw product growth insights from them. Book a demo to learn more.
You see, although we work hard to make Userpilot the best product adoption tool on the market, we know it isnt the perfect fit for every business. Custom dashboards to track key metrics at a glance. Pendo The dashboard on Pendo. Additional reports: You get a built-in Product Engagement Score dashboard.
Plus, the ability to create custom NPS dashboards allow you to analyze the results easily without writing a line of code. Get real-time access to customer feedback via a centralized dashboard that updates as responses come in. 4 Qualtrics for collecting multichannel feedback and B2B market research data Qualtrics NPS surveys.
In its 2020 Embedded BI Market Study, Dresner Advisory Services continues to identify the importance of embedded analytics in technologies and initiatives strategic to business intelligence. Discover the top seven requirements to consider when evaluating your embedded dashboards and reports.
Doug Kessler is the co-founder and creative director at Velocity Partners , a B2B Marketing Agency with a laser-sharp focus on content strategy, and the writer of articles such as The Search for Meaning in B2B , Crap , and Insane Honesty. Stakeholders aren’t always on board with marketers’ ideas of what good content looks like.
Top customer success management platforms for mid-market and enterprise companies. Reports & analytics : Provide tailored analytics, dashboards, and reporting capabilities to track customer engagement, identify trends , and enable data-driven decision-making for improved customer success. Reporting and dashboards.
With the product usage dashboard, you can track user engagement metrics, popular pages and features, top interactions, trends, and even browser preferences. Know what you’re looking for before you start looking Dashboards have been a fad in the SaaS sphere for a while now. And the concept of diminishing returns sets in.
In marketing, they can gauge brand awareness, assess advertising effectiveness, or understand customer preferences. For instance, marketing surveys may inquire about customer awareness of recent campaigns and their influence on purchasing decisions.
Organizations look to embedded analytics to provide greater self-service for users, introduce AI capabilities, offer better insight into data, and provide customizable dashboards that present data in a visually pleasing, easy-to-access format.
Is your team struggling to determine the return on investment (ROI) of product marketing strategies? Or are you looking for ways to improve the performance of your marketing campaigns? In either case, marketing analytics tools can come to your rescue. That, in turn, helps optimize your marketing strategies and budget allocation.
Example: Imagine you’re designing a new dashboard for a fintech app. Example: For our dashboard, we might ask, “How might we create a dashboard that helps analysts quickly spot trends and take action?” Example: Imagine you’re designing a new dashboard for a fintech app. Big difference, right?
Have you ever seen customer satisfaction or felt market readiness? Even if you are used to dashboards, not every outcome is measurable, and you must not confuse the outcome with your progress monitoring. That’s true in general, and planning for outcomes makes it even more difficult.
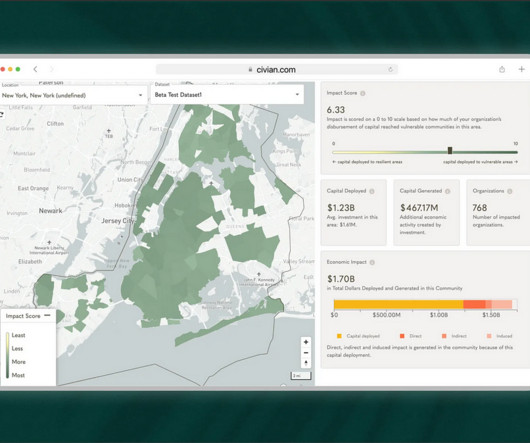
Problem Brief Over a span of 4 weeks, we tested Civians platform and created design solutions to improve the overall user experience of the dashboard. We also encouraged them to think out loud while they were navigating the dashboard, to help us uncover their mental model and identify hidden insights.
Speaker: Jim O'Leary, VP of Product Management, and Brian Elmi, Director of Product Management, NTENT
Most product dashboard review lagging indicators rather than leading indicator and focus on the wrong metrics to move the business forward. Join Jim O'Leary and Brian Elmi of NTENT as they share exactly what they've done to build successful dashboards. How to democratize data so that all teams in an organization can benefit from it.
Strategy: Product/Market Fit Hypotheses. A compelling strategy delineates exactly how your product will dominate its market. The reality is that when you initially start working on a product, you have a set of hypotheses for how you'll dominate your market. But they really are just hypotheses at this point.
This famous line from Field of Dreams is all too representative of how many app publishers face the ‘inessentiality’ of mobile marketing. It’s marketing. Without marketing, even the best apps struggle when it comes to customer acquisition and discovery. App marketing at its most basic. The bad news? The good news?
Dashboard : Customize the analytics dashboard or choose from pre-built ones to easily visualize and compare key metrics over time. Userpilot’s customizable analytics dashboards make metric tracking easier, enabling teams to track changes in performance, user behavior, and engagement at a glance.
In the article, we share 24 customer retention marketing tactics that will help you reduce churn and increase your product performance. Effective customer retention marketing tactics include: Build customer trust from the beginning with a professional website, case studies, testimonials, and transparent pricing. Let’s get to it.
As the analytics landscape has evolved, application teams who need to embed dashboards, reports, and other analytics capabilities in their commercial and corporate applications can choose from dozens of solutions. How do you differentiate one solution from the next? You’ll learn: The evolution of business intelligence.
Well, sorry to disappoint you, but you might be getting excited about the wrong marketing metrics. Userpilot is a product growth platform that you can use to collect, visualize, and analyze user behavior data in custom dashboards. Userpilot custom dashboards allow you to track multiple metrics from one place. Vanity metrics.
Instead, you can build products with a better product-market fit that address all user demands and improve customer satisfaction. However, because customer needs and market conditions are constantly evolving, customer research can’t be a one-time thing. Survey results dashboard in SurveyMonkey. Dashboard example in Hotjar.
Product marketing metrics are key for understanding and optimizing the performance of your product. That said, let’s explore the most critical product marketing metrics to track, along with the latest benchmarks in 2024: Check out the 2024 Benchmark Report. Book a Userpilot demo to see how you can track all your metrics in one place.
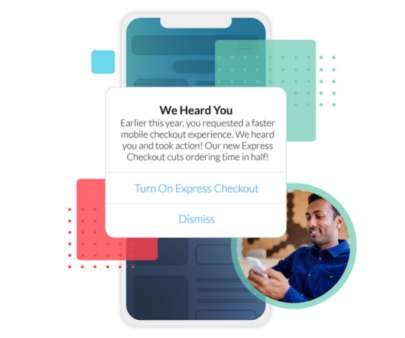
Response targeting can also be utilized by marketing teams to present higher converting offers to customers based on previously indicated preferences, while research teams can easily re-target past survey participants for follow-up questioning to deliver actionable findings faster. Modernized, WCAG-Compliant Interactions. Apptentive SDK 6.0
This helps the individuals create an effective sales and marketing strategy, for example, and to make the right architecture and technology decisions. Product Goals and the Product Backlog. I’d ask myself which additional features are required to meet the product goal and add these to the backlog.
Relative to other standard roles defined in an organization such as Ops, Marketing, Tech etc., A PM may receive help from specialists in the organization such as Researchers, Project Managers, Product Marketing etc. Product strategies frequently have to be changed depending on the market conditions and changing business goals.
Factors I consider when evaluating customer analytics tools Important core features Analytics dashboards : Provide real-time visualizations of key performance indicators (like active users and page views) at a glance, so you can easily track changes. Integrations: Provide seamless data flow with tools like CRM or marketing software.
To better understand the common challenges organizations face with digital feedback tools, we conducted a comprehensive market research study that revealed several critical pain points. While reaching them through digital channels should be easy, it often proves to be a challenge.
Wondering what a marketing growth strategy is? From this article, you will find out how to develop a strong growth marketing strategy and learn growth marketing tactics for different customer journey stages. Market penetration is about increasing existing market share with existing products. Let’s get to it.
Overlapping responsibilities and conflicting priorities are just a couple of the many friction points between product managers and product marketing managers – leading to inefficient workflows and potential product failures. What are the typical roles and responsibilities of product managers and product marketing managers?
The mParticle platform helps mobile marketers, product managers, and data scientists seamlessly connect mobile data with the multitude of app services powering their growth initiatives. Mobile marketers and product managers can immediately take action on events in Apptentive by simply flipping a switch.
Businesses invest heavily in product marketing through webinars, blog posts, and video content for a reason – it gets them notable results. If you’re looking to start or improve your SaaS product marketing strategy, this is the article to read. Both are vital for SaaS success. If you want to know more, book a demo now !
The story you tell to the market, the competitive moats you build, the pricing models fueling your growth – everything that got you to where you are needs to be reimagined for your new buyer. Analysts estimate that by 2022, global corporate eLearning will grow to be a $30 billion market.
Mobile marketers and product managers can immediately take action on events in Apptentive by simply flipping a switch. Our SDK is instrumented into mParticle, and when a mParticle customer decides to leverage Apptentive, a switch is flipped on in their dashboard which gives them immediate access to Apptentive.
Communicate findings effectively A well-structured custom dashboard makes it easier for you to share insights across teams. When we launch a new feature, we create a funnel dashboard to measure how many users discover, activate, and keep using it. Looker Studio: Best for creating free, customizable dashboards with Google integrations.
Intercom’s Kate O’Hanlon recently caught up with Mark to talk about his approach to scaling, and why it’s a mistake to think that the formula for success is just about getting product-market fit and then adding sales reps. . The framework consists of three elements: product-market fit, go-to-market fit, and growth and moat.
Mobile marketers and product managers can immediately take action on events in Apptentive by simply flipping a switch. Our SDK is instrumented into mParticle, and when a mParticle customer decides to leverage Apptentive, a switch is flipped on in their dashboard which gives them immediate access to Apptentive.
Inefficient dashboard configuration Traders often leverage dashboards to monitor data from personal accounts, control transactions and contracts, follow the latest currency market trends and shifts. To increase working efficiency, users can tweak dashboards and choose the most topical tabs.
Integrations with other tools: Does it integrate with CRM, marketing automation, and other essential business applications? User analytics: The custom analytics dashboard provides a centralized view of customer data, allowing you to segment, filter, and analyze user behavior. Analytics dashboard in Userpilot. Zendesk dashboard.
We organize all of the trending information in your field so you don't have to. Join 96,000+ users and stay up to date on the latest articles your peers are reading.
You know about us, now we want to get to know you!
Let's personalize your content
Let's get even more personalized
We recognize your account from another site in our network, please click 'Send Email' below to continue with verifying your account and setting a password.


Let's personalize your content