This site uses cookies to improve your experience. To help us insure we adhere to various privacy regulations, please select your country/region of residence. If you do not select a country, we will assume you are from the United States. Select your Cookie Settings or view our Privacy Policy and Terms of Use.
Cookie Settings
Cookies and similar technologies are used on this website for proper function of the website, for tracking performance analytics and for marketing purposes. We and some of our third-party providers may use cookie data for various purposes. Please review the cookie settings below and choose your preference.
Used for the proper function of the website
Used for monitoring website traffic and interactions
Cookie Settings
Cookies and similar technologies are used on this website for proper function of the website, for tracking performance analytics and for marketing purposes. We and some of our third-party providers may use cookie data for various purposes. Please review the cookie settings below and choose your preference.
Strictly Necessary: Used for the proper function of the website
Performance/Analytics: Used for monitoring website traffic and interactions
Get to Know Your User (30 minutes) First things first – who are you solving for? This step is all about understanding who your user is. Example: Imagine you’re designing a new dashboard for a fintech app. This is where you’ll use the classic “How might we…” question to frame the problem.
How to start acting on product analytics the right way? He makes product decisions every day: what stock to order, how to arrange his shelves, and even which Squishee flavors to promote. How to get started with actionable analytics So, if you’ve been doing product analytics wrong, what’s the “correct” way?
A customer sentiment dashboard is a great way to visualize customer feedback and see what users love (or hate) about your product. But how do you collect the right data for your analysis? Customer sentiment dashboards help you generate the following: Sentiment trends over time. Sentiment distribution.
The solution might lie in your ability to create a comprehensive userexperience map. A well-crafted userexperience map can be your secret weapon for understanding customers, identifying pain points, and boosting product engagement. In this article, we explore what this map is all about and how you can create one.
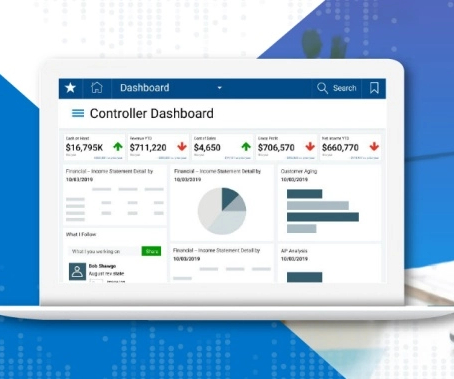
Dashboard design can mean the difference between users excitedly embracing your product or ignoring it altogether. Great dashboards lead to richer userexperiences and significant return on investment (ROI), while poorly designed dashboards distract users, suppress adoption, and can even tarnish your project or brand.
Choose UX research tools with essential features , collaboration, reliable support , user-friendliness, scalability , integrations , and strong security. Userpilot enhances userexperience through in-depth UX research, offering features to gather, analyze, and act on customer feedback.
Basically, anything that ruins the userexperience. How to start your UX analysis. UX analytics involves gathering, analyzing, and interpreting data about howusers interact with your product or service. The goal is to understand howusers interact with a digital experience.
As today’s user increasingly desires swift solutions when using digital products, userexperience optimization can spell the difference between the success and failure of a product. To retain users, continuous improvement of your UX optimization efforts is critical. Analyze the collected data and prioritize changes.
Functionality is a must when it comes to attracting customers, but it’s userexperience that helps you retain them. Wondering how to create an outstanding userexperience ? TL;DR UX design identifies user needs, wants, and pain points and creates engaging products that enable them to achieve their goals.
Userexperience analytics is one of the secret ingredients for boosting SaaS growth. This ensures your product remains enjoyable for users, boosting retention and loyalty. This guide shows you how to get started right away. As you read through, you will learn the different UX data types and how to measure them.
A product adoption dashboard helps you visualize key adoption metrics so you can make data-driven decisions and boost user engagement. In this article, we cover the following: Why you need a product adoption dashboard. Steps to measure adoption using a comprehensive dashboard. Understand howusers adopt new features.
Businesses can use this feedback to improve website navigation, enhance userexperience, and drive conversions. Whether you’re launching a new CX program or ready to take it to the next level, it’s crucial to understand the different types of customer satisfaction surveys and how to use them effectively.
Alongside usability testing, userexperience interface guidelines allow you to build more intuitive and user-friendly solutions. In this blog, we explain eleven userexperience and interaction design guidelines supported by real-life examples to improve product engagement. System status visibility.
If you’re a UX designer or product manager wondering how to deliver a better product in terms of usability and userexperience, this is the article for you. Start improving userexperience and usability with user research. How do usability and userexperience differ?
When you see users creating workarounds, repeatedly checking settings, or abandoning flows at specific points, you uncover the reasoning behind the metrics. Take a look at real userexperiences to understand your users better Conventional tools show you what’s happening, but understanding why requires deeper analysis.
One of these features you should look for is dashboard linking. The following article will delve into dashboard linking, its advantages, and potential benefits across various industries. What Is Dashboard Linking? In embedded analytics , dashboard linking refers to the ability to connect and navigate between multiple dashboards.
One of these features you should look for is dashboard linking. The following article will delve into dashboard linking, its advantages, and potential benefits across various industries. What Is Dashboard Linking? In embedded analytics , dashboard linking refers to the ability to connect and navigate between multiple dashboards.
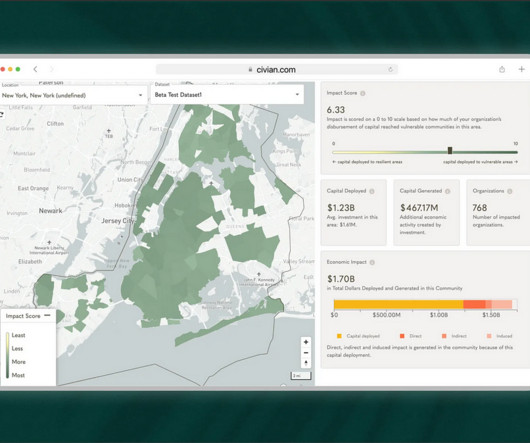
Problem Brief Over a span of 4 weeks, we tested Civians platform and created design solutions to improve the overall userexperience of the dashboard. We also encouraged them to think out loud while they were navigating the dashboard, to help us uncover their mental model and identify hidden insights.
If youre managing a mobile product , I probably dont have to tell you that it is a must to learn how to send push notifications at the right time, with the right message, and to the right users. In short, well go over: How to send targeted push notifications step-by-step using Userpilot. Audience targeting. Why it matters.
Step 1: Identify the metric or feature that requires customer feedback The metric or feature selection depends on what stage the product is at and what problems are being addressed such as how to acquire new customers, how to increase trial conversion rate, how to increase adoption of a new feature, what is the feedback on a particular feature?—?specifically
Free to paid conversion rate This user metric measures the percentage of users who upgrade from a free trial to a paid plan. The free to paid conversion rate is a metric for assessing your onboarding and initial userexperience. Use Userpilot s analytics dashboard to see your user metrics in one place.
How NPS is calculated. NPS survey dashboard in UsrGuiding tool. In reality, UX is multidimensional, and it requires multiple qualitative and quantitative metrics like task success rate, user satisfaction score, and summary of user reviews. Such companies rely on user surveys and feedback to evaluate userexperience.
Unlike standalone BI solutions, embedded analytics allows users to access insights in context without switching between platforms. Streamlined Workflows: Users can analyze data and take action within a single application. Improved UserExperience: Context-aware insights reduce friction and enhance decision-making.
It’s no secret that learning how to evaluate product performance is essential for product management. But how can you effectively measure product metrics that can help you reach your goals and increase revenue growth? Product performance analytics provide deep insights into howusers interact with your product.
Wondering how to improve customer retention? You will also learn how to implement them with Userpilot! TL;DR Customer retention is your ability to keep users using the product. Regularly collect and act on customer feedback to improve the userexperience. How to improve customer retention: Userpilot signup page.
Track them using analytics tools that monitor user behavior and identify trends. To see how much you’ve progressed, compare engagement data before and after implementing new strategies. Userpilot ‘s mobile app performance dashboard. To begin, segment users based on demographics, behavior, and preferences.
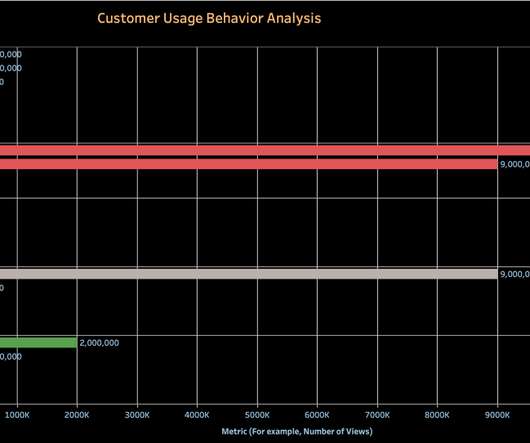
1 Engagement DAU/MAU Understand daily and monthly active user engagement and overall app popularity. 2 Engagement Feature adoption Gauge user interest in new features and optimize feature development. 3 Engagement Average user session length Measure user interactions and identify areas for improved content or flow.
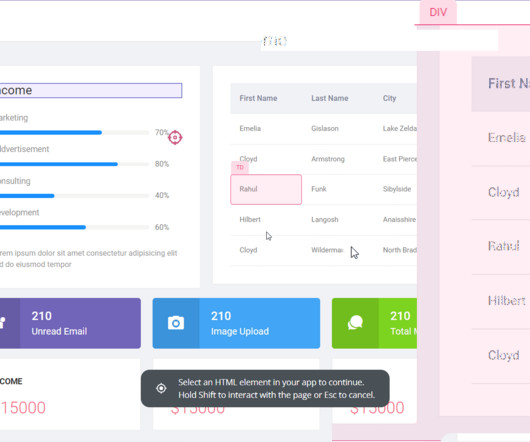
This article will show you different types of click trackers, benefits, and use cases + how to automatically track customer clicks with Userpilot for more effective product analytics. TL;DR A click tracker records where users click, providing insights to optimize layout and enhance userexperience. Sign up for Userpilot.
UserExperience (UX) Creating an intuitive and user-friendly interface is vital to engage users effectively. The userexperience encompasses howusers interact with the platform, access predictions, and customize their settings. A well-moderated platform builds trust among users.
Much of the literature that defines the role as the intersection of business, technology, and userexperience isn't particularly helpful for practitioners who are left wondering what skills they need to learn versus the fine people they work closely with in actual business, technology, and userexperience roles.
interview new customers to understand how your SaaS solution fits into their workflow and tailor onboarding flows accordingly. Usability testing: Observe users as they interact with your product to identify usability issues and collect feedback on userexperience. Survey results dashboard in SurveyMonkey.
If you want to know why users are uninstalling or unsubscribing, tools like screen flow, heatmaps, and screen recordings can get users loving?—?instead Have you ever got so frustrated with an app experience that you immediately started googling how to deactivate your account? Your users have. App churn ?—?the
Not knowing their advantages and relationships, places you at a severe disadvantage with a crucial lack of visibility and end-user satisfaction. What product analytics is and why it matters How to implement product analytics tools effectively What is embedded analytics?
For example, when launching a new feature, the right data visualization tool will let you track user interactions through a funnel report. The goal is simple: make data easy to understand and improve userexperience quickly. How do data visualization tools help product teams? Free to use, with additional paid features.
Wondering how to measure product adoption and retention rates? Read to find out what product adoption and retention metrics to track, how to analyze the data for actionable insights, and how Userpilot can help you. You can also create custom dashboards with up to 30 reports. If yes, this article is exactly what you need!
TL;DR Feature usage examines everything relating to how a product feature is used. Tracking feature usage provides insights that help you prioritize product development, enhance the userexperience , improve engagement , and drive retention. You can also tailor the userexperience to encourage their adoption.
Understanding how to analyze survey data doesn’t have to be complicated. Effectively analyzing data from your user feedback will also help you eliminate assumptions and create marketing strategies that positively impact your audience. Qualitative data can help you draw data-driven conclusions based on user sentiments.
Are you overwhelmed by the sheer volume of customer data and unsure how to analyze it effectively? Customer segmentation analysis allows you to break down your users into distinct groups and gain valuable insights into them. But how do you determine how different segments behave and which are most valuable to your business?
Instead, it is to identify the right and wrong types of friction and remove the bad friction to create a holistic user onboarding journey. How to identify friction points with product analytics. How Userpilot helps you manage friction. How to identify friction points with product analytics? Thats where problems lie.
Userexperience can make or break a web app. If your software is slow or buggy, users wont stick around for long. If youre only finding out about these issues after users complain, youre already too late. Autocapture events dashboard in Userpilot. Build and view custom dashboards in Userpilot.
You can build onboarding carousels, push notifications, in-app messages , and surveys from a single dashboard. Everythings optimized for mobile, so your onboarding experience feels native from the start. User onboarding on mobile doesn’t need to be complex or code-heavy. Why choose Userpilot for mobile onboarding?
UXtweak is the best free userexperience research platform. Userpilot is the product growth platform for user journey analytics. How to choose an analytics tool? Key features Here’s a brief overview of UXtweak’s userexperience research capabilities: Five-second testing. Analytics dashboards.
You log into your dashboard, check your DAU/MAU ratio, and see an upward trend. Think about Duolingos streak feature users log in daily, but are they actually engaged or just avoiding losing their streak? Lets break down what product stickiness really means and how to measure it accurately. Product Usage Dashboard in Userpilot.
In the world of SaaS, having a seamless userexperience can make or break your company's success. This is why conducting a UX audit is so important – to understand where the userexperience is lacking and why. Let's dive deeper into what these steps are and how to go about them.
We organize all of the trending information in your field so you don't have to. Join 96,000+ users and stay up to date on the latest articles your peers are reading.
You know about us, now we want to get to know you!
Let's personalize your content
Let's get even more personalized
We recognize your account from another site in our network, please click 'Send Email' below to continue with verifying your account and setting a password.


Let's personalize your content