This site uses cookies to improve your experience. To help us insure we adhere to various privacy regulations, please select your country/region of residence. If you do not select a country, we will assume you are from the United States. Select your Cookie Settings or view our Privacy Policy and Terms of Use.
Cookie Settings
Cookies and similar technologies are used on this website for proper function of the website, for tracking performance analytics and for marketing purposes. We and some of our third-party providers may use cookie data for various purposes. Please review the cookie settings below and choose your preference.
Used for the proper function of the website
Used for monitoring website traffic and interactions
Cookie Settings
Cookies and similar technologies are used on this website for proper function of the website, for tracking performance analytics and for marketing purposes. We and some of our third-party providers may use cookie data for various purposes. Please review the cookie settings below and choose your preference.
Strictly Necessary: Used for the proper function of the website
Performance/Analytics: Used for monitoring website traffic and interactions
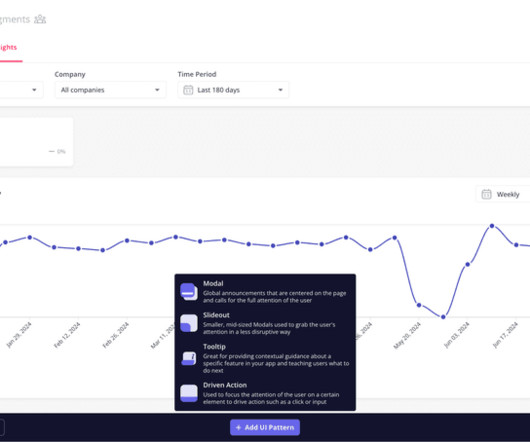
Without effective UX analytics that goes beyond collecting data, you’re losing valuable customers. Unfortunately, the research backs this up, with a staggering 90% of users reporting that they stopped using an app due to poor performance. It covers key topics, such as: Defining UX analytics. What is UX analytics?
You reach out to all department heads and request to get data for your analysis: Marketing team for data on campaign conversion, customer support for data on call volumes, account team for data on customers feedback, product data for usage, etc. What is a product operations dashboard?
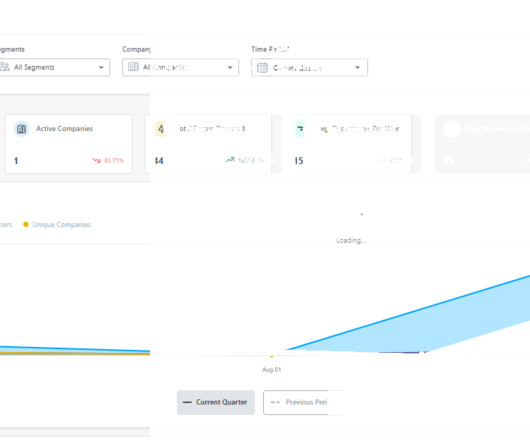
Are you tracking SaaS metrics without knowing how to make the analytics process easier? Analyticsdashboards are visualizationtools that give you an overview of key metrics. This makes it much easier to extract insights from your analysis compared to looking at mere numbers. Book a demo to learn more.
As you might know, session replay tools track every click, scroll, and hiccup from your usersjust as if you were watching through their eyes. They allow you to close the gap between your analyticsdata and the feedback you get from users. But with so many session replay tools, which ones are worth your time and money?
Pro Tip: Pair your quick wins with data. A dashboard showing metrics like feature adoption or user engagement amplifies your credibility. Advanced Tactics: Stakeholder Mapping: Use tools like the Stakeholder Alignment Blueprint (available on jonihoadley.com) to identify key goals and concerns. Click here to download.
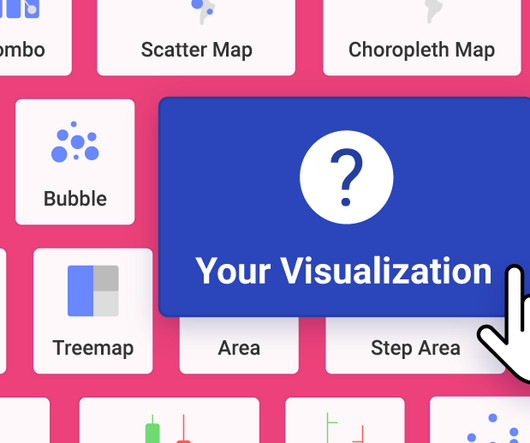
Visualdata surrounds us – colorful charts on weather reports, infographics on the web and in social media articles, map charts in presentations, etc. To help you get started with datavisualization, this article explores various visualization methods and their use cases. Funnel charts. Pie charts.
Are you looking for a session replay tool but not sure if Fullstory is the right option for your SaaS? The tool’s pros and cons. Pinpoint bug locations by linking user sessions to bug reports or customer tickets. This is essential for compliance with privacy and data protection regulations like GDPR or CCPA.
A Brief Introduction to Thomas’s Work: What Is Intelligence Analytics and the Dark Web? Thomas Groendal is the Senior Product Manager at Bluestone Analytics , a subsidiary of CACI , a $6 billion company that focuses on intelligence analysis. Bluestone Analytics in particular has two main products, DarkBlue and DarkPursuit.
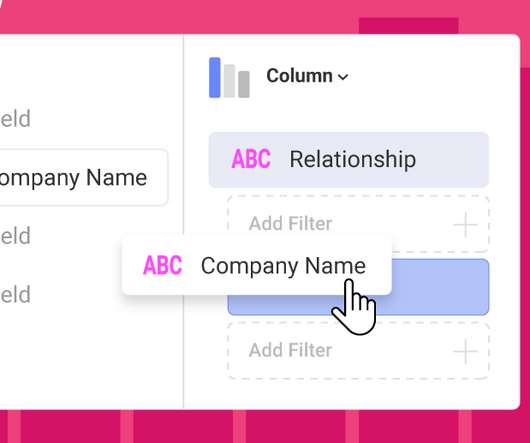
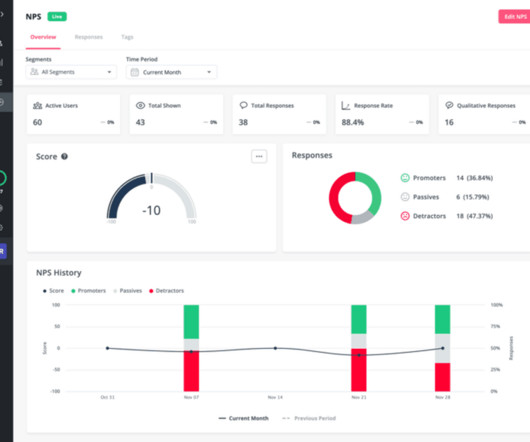
A customer sentiment dashboard is a great way to visualize customer feedback and see what users love (or hate) about your product. But how do you collect the right data for your analysis? This article shows you a step-by-step process and some of the best tools to use. Track customer behavior for experience insights.
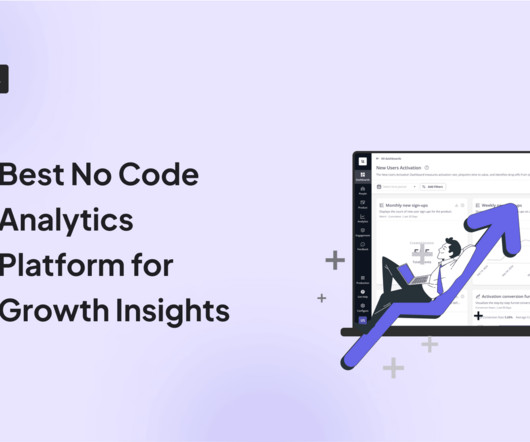
Dataanalytics plays an instrumental role at every step of building a successful product. Whether you’re building your user base or releasing a new feature, the right no-code analytics platform can help you make evidence-based decisions. Many of these tools even come with AI capabilities. Let’s get right to it.
If you’re shopping around for a mobile app analytics platform before biting the bullet with Fullstory, you’ve landed in the right place. FullStory is a robust web and analyticstool but there are platforms out there that may specialize in one of the features you want. Best for AI-powered future outcomes predictions.
CRR formula, reference values andexample Customer Retention Rateformula Number of customers at the end of the period : Total number of customers at the end of the measuredperiod. Reference values CRR varies widely across industries due to differences in customer expectations about business. Tracking retention in Google Analytics.
Reveal Embedded Analytics Embedded analytics platforms have gained popularity as businesses seek to leverage data for decision-making and gain a competitive edge. One of these features you should look for is dashboard linking. What Is Dashboard Linking? However, not all solutions are the same.
Reveal Embedded Analytics Embedded analytics platforms have gained popularity as businesses seek to leverage data for decision-making and gain a competitive edge. One of these features you should look for is dashboard linking. What Is Dashboard Linking? However, not all solutions are the same.
The choice is tough because there’s no single tool that covers all use cases. What’s worse, you will find multiple tools in each category, making it incredibly difficult to pick the tool that satisfies your needs and offers the best value for money. Which product feedback software should you choose for your SaaS?
Reveal Embedded Analytics We live in an era where data shapes decisions across industries. While datavisualizations have become essential, not all standard visualizations cater to specialized reporting needs. Dive in to discover its unmatched benefits and how you can craft unique reports effortlessly.
Welcome to Product PickEm 2025 , where the best emerging product tool startups go head-to-head in a bracket-style competition, and YOU decide which ones rise to the top via our LinkedIn polls on the Productside page. Each round, the lowest-scoring tools get eliminated, and the best move forward. Forget the hype. Four winners.
Heap and Google Analytics are popular product analyticstools that help businesses pursue product growth with data-driven insights. In this article, we’ll go through the main differences between both tools to help you understand which one is better for you. respectively. What is Heap?
Analyticstools offer a competitive advantage for companies investing in prolonged product growth. However, not all companies can invest precious resources in an analyticstool. In reality, some companies are better served using free vs paid analytics platforms. There are different types of analyticstools.
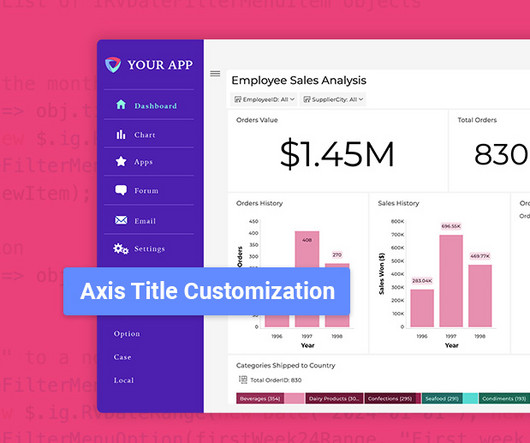
Reveal Embedded Analytics This update is packed with customization, usability, and performance improvements to help you build seamless, high-impact analytics experiences faster. Fixed Lines for Charts: Set static reference points to highlight key data trends. Improved Usability: Quickly find and analyze key information.
Want to conduct customer journey visualization but not sure what’s the best way to do it? This article shows you a step-by-step process for collecting customer data and creating easy-to-understand visual maps. Understanding these steps and the motivations behind them enables you to support customers in succeeding with your tool.
But with so many tools in the market, which one should you choose for product analytics ? Unlike sales funnel software, funnel-tracking tools track numerous funnels such as goal completion, conversion , and review funnels. When selecting a funnel tool, look for customization, integrations, segmentations , and dashboard options.
Reveal Embedded Analytics. Traditional business intelligence and analytics solutions are made for data analysts and technical users. But in today’s fast-paced business environment, all users, regardless of skills and department need quick and easy access to data and the ability to work with it on their own.
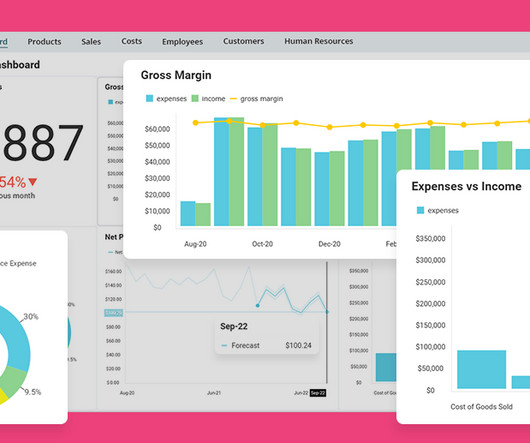
We live and work today in a world that is increasingly data-driven, but we cannot successfully adopt a data-driven approach to decision making without first identifying the metrics that matter most. Plus, there’s no shortage of tools to help us quantify seemingly everything. The real issue is lack of focus. In This Article.
The “shiny penny” approach (focus all your attention on the hottest tools in the market) or “head in the sand” approach (fall victim to analysis paralysis and avoid choosing any tools) are no longer viable. But here’s the thing: a tool is not a strategy. The anatomy of a marketing tech stack [with recommended tools].
SaaS tools are the industry's biggest open secret. Wondering what type of tools you should have in your stack? TL;DR SaaS tools are applications that users can access through an internet connection. There are different types of SaaS tools for different purposes. ProductPlan is the best tool for road mapping.
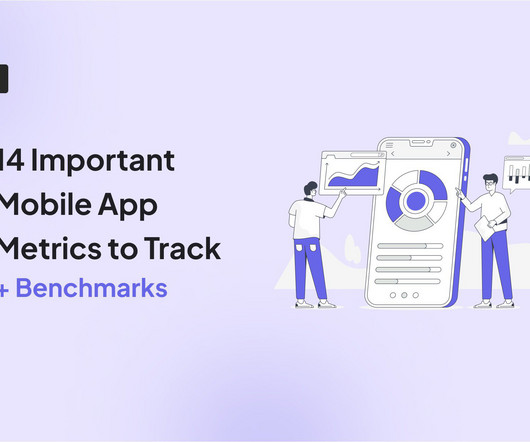
Overview: Mobile app analytics metrics Below is a quick summary of the mobile metrics every PM should be tracking. 10 Revenue User lifetime value Predict long-term user value and guide strategic decisions on user acquisition and retention. This helps you avoid data fragmentation and make better decisions.
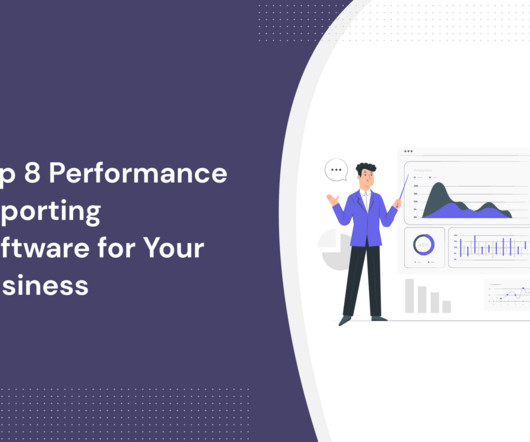
Knowing how well your products and campaigns perform can give you the most vital insights needed to guide your business. Having the right performance reporting solution for product analytics in your arsenal optimizes risk management and aids in financial planning by ensuring each decision you make is data-driven.
When it comes to boosting your product growth, user tracking tools can make your life a lot easier. They offer insights into product performance , what your users are doing inside your product, and why they are doing it. But how do you know you’re picking the right tools? Tableau is the best user datavisualizationtool.
Want to know how you can use survey analytics to leverage customer feedback data? Survey analytics is the process of interpreting survey responses to get valuable insights. TL;DR Survey analytics is the process of interpreting user feedback from surveys to gain actionable insights and identify improvement opportunities.
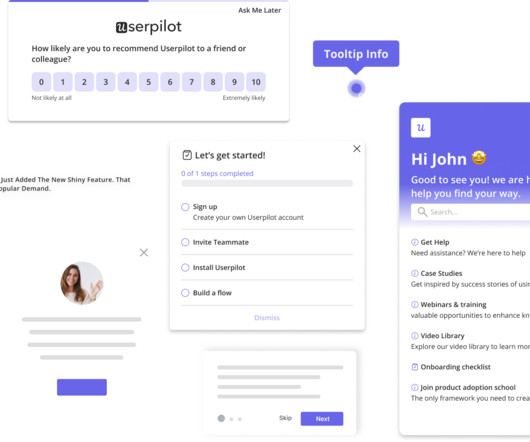
Product-led growth tools allow you to improve your product experience by analyzing customer data and adding in-app interventions. However, having a different tool for each functionality can make product-led growth sound too much of a hassle. All-in-one tools for product-led growth : Userpilot. Salesforce. Get a demo.
In this article, we’ll explain what user sentiment analysis is, why it’s important, and uncover some of the best tools for tracking and analyzing customer sentiment. TL;DR User sentiment is the feeling a person has about your brand, product, or service quality. Gather user sentiment data from multiple sources.
Reveal Embedded Analytics Introduction to Embedded Analytics in Angular and.NET Core Embedded analytics is no longer an optional featureits a necessity for modern applications. In 2025, users demand seamless access to real-time insights directly within the tools they use daily. Why is Embedded Analytics Essential?
When combined with product analytics , end-user behavior monitoring can help you boost product usage and retention rates. In this blog, we’ll discuss the steps to help you get started and outline a few tools that’ll come in handy. Next, select the right user report you need for monitoring their behavior.
The article here focusses on business criterion to use to better evaluate if a predictive model is ready for production and the associated risk when the predictions are wrong. Optimized for better outcomes Today, businesses regularly use predictiveanalytics to optimize their business and achieve better business outcomes.
Looking for customer analytics use cases that can significantly improve your SaaS? We also cover: Customer analytics categories. The three types of customer analytics and their significance. How to measure customer behavior with dataanalytics. There are four categories of customer analytics categories.
Finally, you might be wrong and be missing out on potentially important insights because of an unwillingness to understand the person’s reasons. I think a datavisualizationdashboard would be great as a first screen in the back-office.”. Because otherwise users have to go to the reports screen, and they shouldn’t.
Unfortunately, that technology isn’t here yet, so UX research tools are the next best thing. These tools can provide you with the qualitative and quantitative data you need to understand how your customer behaves in your product, so you can make the necessary changes to improve their experience.
Amplitude Analytics is one of the most popular digital analyticstools for SaaS businesses. It offers valuable insights into user behavior to drive growth and enhance your user experience. But is Amplitude the right tool for your company? What is Amplitude Analytics? Source: Amplitude.
Every company, of every size — even organizations of just one person — are navigating a data avalanche problem. Every team — from product to marketing, and IT to engineering — is generating data. A strong analytics stack is foundational to being able to make sense of it all. Data Tracking and Collection. Event Data.
Customer insights provide intelligence and analysis about customer experience, activities, and preferences. That said, let’s go over what type of data you can collect and explore some customer insights examples you can learn from. Purchase data to find conversion drivers that influence users to purchase a plan or upgrade.
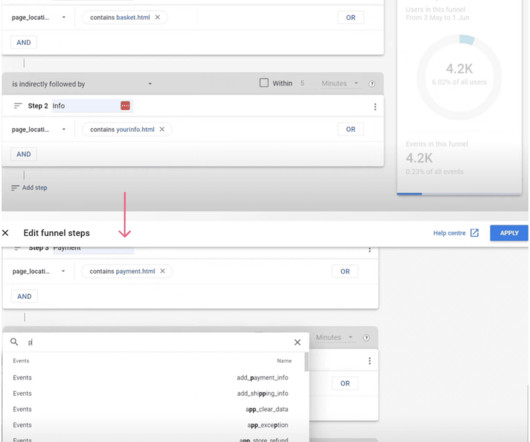
Having funnel analysis tools that provide comprehensive analyticalinsights about where and why users drop off will solidify your business’s competitiveness in the long term. TL;DR Funnel analyticsrefers to the analysis of events across all stages of every customer journey. Prices available upon request).
All data strategies start with excitement. This excitement can dissipate as teams find themselves stuck with data they don’t trust, tools they don’t know how to use and overwhelm with the sheer volume of their data. In this blog post, I will help you understand and tackle 3 pervasive data issues: . Data overwhelm
Hotjar has long been a go-to tool for understanding user behavior, but its not the only player in the game. Whether youre looking for easy-to-use Hotjar alternatives with advanced product analytics and a better pricing structure, we are here to help! In fact, it has been struggling to keep up with others for a while.
We organize all of the trending information in your field so you don't have to. Join 96,000+ users and stay up to date on the latest articles your peers are reading.
You know about us, now we want to get to know you!
Let's personalize your content
Let's get even more personalized
We recognize your account from another site in our network, please click 'Send Email' below to continue with verifying your account and setting a password.


Let's personalize your content