Remove Dashboard Remove Data Visualization Remove Information
article thumbnail

Announcing powerful new Intercom reporting features: conversation topics and custom reports

Intercom, Inc.

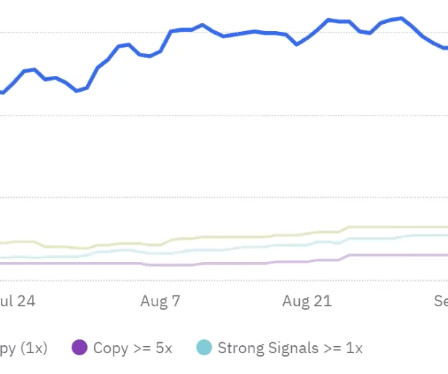
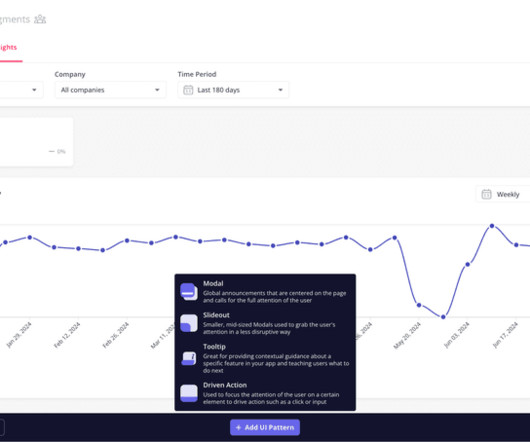
They should be able to use all this extra information to offer a more personal, tailored customer experience and effective support, surely? Well, it’s not quite that simple – despite the influx of customer conversations, it can be hard to derive meaningful insights from all that data.

article thumbnail

10 Analytics Dashboard Examples to Gain Data Insights for SaaS [+Best Tools]

Userpilot

Are you tracking SaaS metrics without knowing how to make the analytics process easier? Analytics dashboards are visualization tools that give you an overview of key metrics. This makes it much easier to extract insights from your analysis compared to looking at mere numbers. Book a demo to learn more.

Insiders

Sign Up for our Newsletter

This site is protected by reCAPTCHA and the Google Privacy Policy and Terms of Service apply.

article thumbnail

What is Data Visualization? + Visual Data Tools

Userpilot

Visual data surrounds us – colorful charts on weather reports, infographics on the web and in social media articles, map charts in presentations, etc. To help you get started with data visualization, this article explores various visualization methods and their use cases. Funnel charts. Pie charts.

article thumbnail

Product in Practice: Iterating on Outcomes with Limited Data

Product Talk

A Brief Introduction to Thomas’s Work: What Is Intelligence Analytics and the Dark Web? Thomas Groendal is the Senior Product Manager at Bluestone Analytics , a subsidiary of CACI , a $6 billion company that focuses on intelligence analysis. Bluestone Analytics in particular has two main products, DarkBlue and DarkPursuit.

article thumbnail

Monetizing Analytics Features: Why Data Visualizations Will Never Be Enough

Think your customers will pay more for data visualizations in your application? But today, dashboards and visualizations have become table stakes. Discover which features will differentiate your application and maximize the ROI of your embedded analytics. Brought to you by Logi Analytics.

article thumbnail

SaaS Customer Onboarding Dashboard: Definition & Examples

Userpilot

In SaaS, a customer onboarding dashboard can become a massive product analytics tool to understand and optimize the user journey. But what type of dashboards can you use to analyze your onboarding process? Let’s explore how a customer onboarding dashboard works and see different examples.

article thumbnail

Customer Sentiment Dashboard: Definition & Examples

Userpilot

A customer sentiment dashboard is a great way to visualize customer feedback and see what users love (or hate) about your product. But how do you collect the right data for your analysis? This article shows you a step-by-step process and some of the best tools to use. Track customer behavior for experience insights.

article thumbnail

A Guide to Designing Delightful Dashboards

Speaker: Daniel O'Sullivan, Product Designer, nCino and Jeff Hudock, Senior Product Manager, nCino

We’ve all seen the increasing industry trend of artificial intelligence and big data analytics. In a world of information overload, it's more important than ever to have a dashboard that provides data that's not only interesting but actually relevant and timely. Dashboard design do’s and don’ts.

article thumbnail

Add Value with a Dashboard Refresh: What You Need to Know

Speaker: Miles Robinson, Agile and Management Consultant, Motivational Speaker

Dashboards and analytics can really set your application apart, but that doesn't mean you can implement them and forget about them. Join Miles Robinson, former UX and Design Manager, as he explains the different ways to refresh your dashboards - and how to determine what's the best path to product dashboard success.