This site uses cookies to improve your experience. To help us insure we adhere to various privacy regulations, please select your country/region of residence. If you do not select a country, we will assume you are from the United States. Select your Cookie Settings or view our Privacy Policy and Terms of Use.
Cookie Settings
Cookies and similar technologies are used on this website for proper function of the website, for tracking performance analytics and for marketing purposes. We and some of our third-party providers may use cookie data for various purposes. Please review the cookie settings below and choose your preference.
Used for the proper function of the website
Used for monitoring website traffic and interactions
Cookie Settings
Cookies and similar technologies are used on this website for proper function of the website, for tracking performance analytics and for marketing purposes. We and some of our third-party providers may use cookie data for various purposes. Please review the cookie settings below and choose your preference.
Strictly Necessary: Used for the proper function of the website
Performance/Analytics: Used for monitoring website traffic and interactions
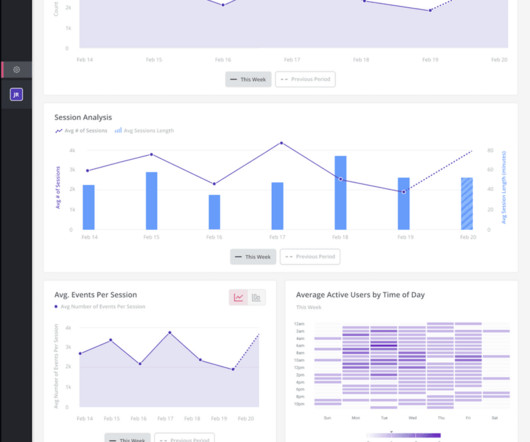
With an abundance of product analytics to track, having a robust SaaS KPIdashboard is essential to monitor the metrics that matter most. This guide will walk you through what it is, why you need one, and how to build your very own dashboard. What is a SaaS KPIdashboard? Why do you need SaaS dashboards?
Customersatisfactionanalytics are key to understanding what makes your customers happy and building a product that retains users. But how can you leverage this user sentiment data to lead product development and grow your business? There’s no single KPI to measure customersatisfaction.
If you are a SaaS company, the chances are you’ve come across the term “self-serve analytics” at some point online. Unlike traditional data analysis methods, self-serve analytics equips everyone in your organization to explore data and take the right actions in real time. Choosing a good business intelligence tool.
Modern customers expect quick, personal, and effective service. To provide this, you must understand how your customer experience stacks up against these expectations. But with so much data to consider, how can you define the help desk metrics that matter for your team? What are help desk metrics?
Wondering how to build a customer success dashboard for your team? From the article, you will learn what a customer success dashboard is, why you need it, and what metrics it should include. And how to build a dashboard for your customer success team using Userpilot analytics !
As you’re researching customeranalytics platforms, you’ve probably noticed how hard it is to find reliable information on the available solutions. TL;DR Customeranalytics platforms are specialized tools that allow you to collect and analyze data. Want to get started with customeranalytics?
Which product analyticstools should you be using? How many analyticstools do you need? And what type of analytics really matters for a product marketing manager? By the end, you'll know the only type of analyticstools you really need as a PMM. What is product analytics?
Do you need some behavioral KPI examples to understand what metrics to track and why? Behavioral key performance indicators (KPIs) can help you understand user experience and measure feature adoption. Then you can use its valuable insights to make data-driven decisions for your SaaS business.
That said, let’s explore the most critical product marketing metrics to track, along with the latest benchmarks in 2024: Check out the 2024 Benchmark Report. TL;DR Product marketing metrics are specific data points used to assess the performance of a product marketing strategy.
How badly do you want to know if your customers are truly satisfied with your services? Getting this qualitative data can be tricky. A customersatisfaction survey is a lynchpin to developing a loyal, returning, and referring customer base. Why Is a CustomerSatisfaction Survey Important?
Surveys are one of the most effective ways to collect user feedback and actionable product analytics. In this guide, we’re going to go through: The SaaS analytics you can gather through surveys. Collecting a combination of quantitative and qualitative data is the best way to avoid survey bias. Let’s get into it!
Benefits of a product strategy framework include better alignment between product development and business goals and improved usersatisfaction. Analyze in-app usersatisfaction using tools like NPS and CSAT surveys. Improve your product based on qualitative and quantitative data on user behavior and sentiment.
Having trouble deciding which customerserviceKPI to use? There are some vanity metrics among the KPIs for customerservice. So let’s look at the most important KPIs that will help you create strategies to provide superior customerservice and boost retention.
UX KPIs, or user experience key performance indicators, are essential numerical data points that are used to track, measure, and compare the experience users have with your SaaS product. User experience (UX) involves all aspects of user interactions with your product. What is user experience (UX) in SaaS?
The Role of Data in Defining Your North Star Metric How the Right North Star Metric Can Illuminate Your Business Path A North Star metric is a key performance indicator (KPI) that a company uses as the leading measure of its success. This metric should represent the core value your product delivers to customers.
Along with affordable pet boarding provided by insured pet sitters, Mad Paws provides other services for pet owners such as dog walking and pet sitting. How Mad Paws uses analytics to learn more about their business and woo investors. Mixpanel: Can you speak about how, as a start-up, you use data to attract investors?
Customer feedback surveys serve as invaluable tools for gathering actionable insights directly from your audience. However, it’s important to know when and how to trigger the forms to gather user feedback , for increased response rate and data credibility. Track overall satisfaction with your product or service.
The data obtained from the process lets you adapt and refine your strategies, ensuring you make proactive moves to improve key growth metrics. The best visualization types to make actionable decisions from your analysis. Determine the right analysis report to use. Customizedata points.
The 1-month retention rate measures the percentage of users still using your product one month after initial engagement. NPS (Net Promoter Score) measures users’ likelihood of recommending your product to others. CSAT ( CustomerSatisfaction Score ) measures customers’ satisfaction with your product or service.
Customer journey KPIs, alongside product analytics , help product teams understand if they’re meeting their goals. This insight can help you make informed decisions to optimize your user experience. TL;DR The 5 stages of the customer journey maps are Awareness, Activation , Adoption , Retention , and Referral.
There are all kinds of metrics you can measure when it comes to assessing your customer support, and while they will change from industry to industry and from business to business, they will usually seek to measure some blend of quality, speed and customersatisfaction. Customersatisfaction (CSAT) scores.
Growth-focused companies pay less attention to acquisition and more to retention because they understand retention has ripple effects—satisfied and loyal customers become your brand advocates , bringing new users through word of mouth. There’s data to prove the importance of retention over acquisition. Formula to calculate MRR.
OKRs are different from KPIs because a KPI is strictly a metric that reflects performance. Userpilot can help marketing teams with OKRs with our product usage analytics and in-app goal tracking. There are two main performance frameworks in product marketing – OKRs and KPIs. Increase usersatisfaction.
Then, I’ll go a bit deeper and look into 10 user persona examples for 3 SaaS tools, to showcase how products with several different use cases can have dramatically different personas. What is a user persona? SaaS User Persona Example-Kontentino: Social Media Account Manager in an Agency Wrap up.
But as data-driven decision making takes on increased significance, we’ve seen “ product ops ” emerge to fill in the gap between the leadership and vision aspects of the product management and the facts and figures that inform team members. Manage with data: While we used to beg for information, now we find ourselves drowning in it.
Wondering which product management KPIs help you get better product growth insights ? Among the plethora of responsibilities that SaaS Product Managers have, defining and tracking KPIs probably is the most influential towards guiding future product development. But how do you know if you’re tracking the right KPIs?
There are 10 retention KPIs you should look out for. These include customer retention rate , monthly recurring revenue, customer lifetime value , DAU to MAU rate , repeat purchase rate, expansion MRR , customersatisfaction score , net promoter score , customer health score , and the revenue churn rate.
From analyzing market trends to churning user needs and technical feasibility into golden product ideas, there are many benefits of ChatGPT for product managers. A potent tool, ChatGPT has proven to be a strategic addition to the product management toolkit, churning out ideas in even the most unlikely scenarios.
– Use interactive walkthroughs to guide users and more. Userpilot is a versatile product growth platform that can help you collect the necessary data and build personalized in-app experiences code-free. What are customer success OKRs? Gain customerinsights to develop customer-centric strategies.
In the world of SaaS (software as a service) it usually comes down to one person who devises a strategy for developing and unraveling a perfect product. Using a good collaboration tool with a clearly outlined roadmap is one way to keep tabs both on the “business as usual” and “creative vision” aspects of the product.
Are you tracking the right Product Marketing KPIs? With so many product growth insights available to every product marketer, it’s sometimes hard to understand which metrics are relevant and which you should be tracking to measure the success of your product marketing. What is a Product Marketing KPI metric?
KPIs are important for SaaS companies as they help you monitor different aspects of your product, help visualize performance, and identify problems fast. The three main types of KPIs are quantitative, qualitative, and leading KPIs. Using exit surveys to understand why customers leave and offer alternatives to avoid churn.
On the other hand, KPIs highlight your success in achieving a key result, and metrics provide data you can track to identify bottlenecks in your business. To implement your OKR strategy, you should follow 5 steps: set vision, choose OKRs, review OKRs progress, create feedback loops, and make reports. OKR vs KPI vs Metrics.
The RACE marketing model was designed by Dr. Dave Chaffey, co-founder and content director of Smart Insights. The four stages of the RACE framework implement marketing strategies to Reach new customers, encourage them to Act or interact with your website or social media pages, drive Conversion , and boost long-term Engagement.
Customers are actively sharing their thoughts on social media and review sites, making these places valuable sources of customer feedback. To access this large pool of actionable data, you need to conduct sentiment analysis. If you’re ready to get started with customer sentiment analysis, then read on!
A feature adoption funnel moves users through the four stages of adoption (Exposed > Activated > Used > Used Again) with the goal of maintaining healthy feature adoption rates across the board. Make the onboarding process as contextual and enjoyable as possible to kick the customer experience off on a high note.
Userpilot is comprehensive product adoption software with advanced analytics , feedback, and engagement features. These can be challenging to quantify in monetary terms and include improvements in internal business processes leading to increased productivity or improved customerservice , to name just a couple.
Simply put, the SaaS sales funnel is a visual representation of your sales process, starting from lead generation to qualification, to conversion, and then retention. By identifying key metrics , you can make insightful decisions based on actual data instead of hunches and assumptions. User retention rate formula.
User behavior analytics are part of the puzzle for a SaaS company’s success. They unlock the insights, both said and unsaid, by customers, and create better product decisions for customers over time. If you need even more context, feel free to check out our ultimate guide to customer feedback.
It all starts with a clear hypothesis on who the target audience is for your product or service. Before getting into the specific solution your product or service provides, it's important to have a clear understanding of the specific problem or pain point that your solution solves for. Target Audience. Problem You're Solving.
By using these KPIs, you can calculate how quickly you lose customers, their lifetime value, and their overall health scores. There are eight key CX KPIs that you need to measure. There are lots of tools in the market to measure and improve your customer experience. What is customer experience?
However, there are some key app analytics metrics that all app product managers should look at. Active App Users You can segment and track active app users by: DAU: Daily Active Users?—?the Weekly active users (WAU) and Daily active users (DAU) on the UXCam Dashboard.
Another great way to think about KPIs is to view of them as Health Metrics – How’s the health of certain important measures we don’t want to forget about? But KPIs can only help us target and measure part of the story. We definitely wouldn’t want to use them everywhere, to manage every team, in every situation.
Cohort analysis is one of the most useful kinds of product analyticsreports. For example, acquisition cohorts or users who engaged/didn’t engage with a feature. Finally, use an analyticstool to generate the cohort analysis reports. More complex use cases normally require multiple reports.
We organize all of the trending information in your field so you don't have to. Join 96,000+ users and stay up to date on the latest articles your peers are reading.
You know about us, now we want to get to know you!
Let's personalize your content
Let's get even more personalized
We recognize your account from another site in our network, please click 'Send Email' below to continue with verifying your account and setting a password.


Let's personalize your content