This site uses cookies to improve your experience. To help us insure we adhere to various privacy regulations, please select your country/region of residence. If you do not select a country, we will assume you are from the United States. Select your Cookie Settings or view our Privacy Policy and Terms of Use.
Cookie Settings
Cookies and similar technologies are used on this website for proper function of the website, for tracking performance analytics and for marketing purposes. We and some of our third-party providers may use cookie data for various purposes. Please review the cookie settings below and choose your preference.
Used for the proper function of the website
Used for monitoring website traffic and interactions
Cookie Settings
Cookies and similar technologies are used on this website for proper function of the website, for tracking performance analytics and for marketing purposes. We and some of our third-party providers may use cookie data for various purposes. Please review the cookie settings below and choose your preference.
Strictly Necessary: Used for the proper function of the website
Performance/Analytics: Used for monitoring website traffic and interactions
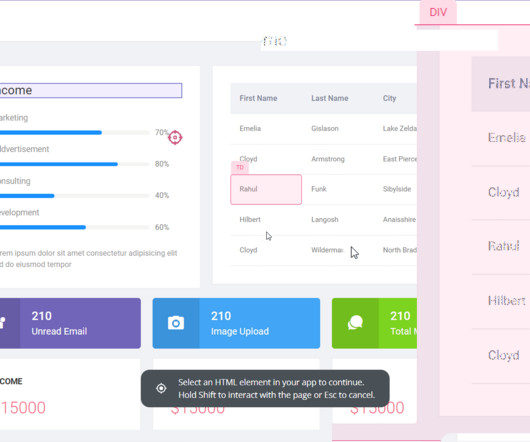
Data visualization tools help turn your messy spreadsheets into clear, interactive insights. For example, when launching a new feature, the right data visualization tool will let you track user interactions through a funnel report. The goal is simple: make data easy to understand and improve user experience quickly.
As you’re researching dashboard reporting tools, you’ve probably noticed how hard it is to find reliable information on the available solutions. To make your life a little bit easier and help you choose the best dashboard analytics tool for your SaaS, we’ve produced a guide of 12 excellent platforms available on the market in 2024.
The different reports can offer a variety of insights that help manage your product in the right direction. The most important metrics to track are: Customer acquisition cost : The amount spent to acquire a new customer. Conversion rate : The number of customers that convert into paying customers.
Marketing technology – or MarTech – stacks are the groups of technologies that marketers use to execute, analyze and improve their marketing across the customer lifecycle. WordPress lets users build everything from blogs to full-blown websites with 100s of themes to choose from. Intercom – live chat and customer engagement.
Are you looking for Zendesk integrations to boost the efficiency of your self-service customer support? The article explores the best Zendesk integrations for: Customer support Customerfeedback Productivity Email and social media communication Analytics and reporting Let's get right to it!
This is where tools such as Reveal and Looker come in handy – they convert raw data into easy-to-understand and easy-to-use insights that enable organizations to reshape and modernize the way they do business. What is Looker? What Is Looker? Reveal VS Looker – Comparing Features & Functionalities.
TL;DR A business intelligence (BI) analyst is a data specialist who helps businesses translate raw data into actionable insights. A business intelligence (BI) analyst is a data specialist who helps businesses translate raw data into actionable insights. Without further ado, let’s get into it! Book a demo to see it in action!
It is important to customize the components of your analytics stack to meet your business’s unique needs. Events” are user actions, or what a company would define as a meaningful transactional moment. mParticle : mParticle is a mobile-first customer data platform that offers support for web data, too. Event Data. Major Players.
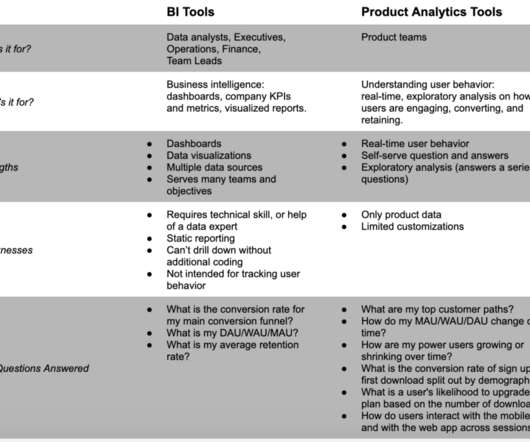
In 2019, industry-leading Business Intelligence tools (BI tools), Looker and Tableau, were acquired by Google and Salesforce for over $18 billion combined. Looker, and other tools like it, are often deployed with good intent. A product analytics solution that is self-serve and built to answer product questions related to user behavior.
Up until now, that was handled by Mixpanel and Looker, our BI (business intelligence) solution of choice. I’d like to share how we worked with our product, engineering, and design teams to inspire and dogfood the best business analytics solution and what we’re gaining today by moving off of Looker. Second, event tables were immutable.
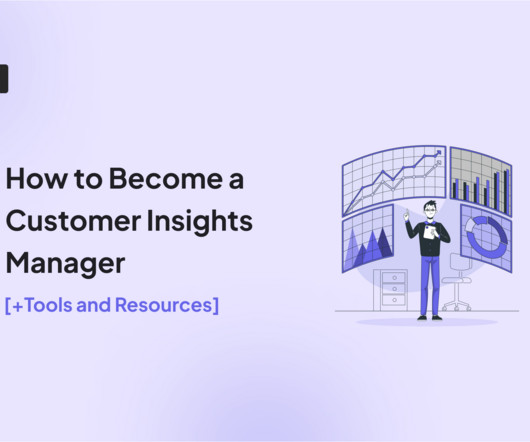
Embarking on a career as a customerinsights manager involves a combination of education, skills development, and practical experience. This guide will provide you with a comprehensive overview of the path to becoming a successful customerinsights manager. Let’s dive in!
Tracking cross-platform analytics is essential for product teams to see a complete view of customer behavior. TL;DR Cross-platform analytics is the activity of tracking and analyzing user behavior across multiple platforms or devices. Tools like Google Analytics or Amplitude allow you to track user behavior across all platforms.
With its robust capabilities to expand your business, add value to your customers, and ultimately grow your profits, embedded analytics solutions are becoming essential for businesses that want to be able to survive in the market. Instead, users can look at key business data in context increasing their productivity and efficiency.
Have you ever made a costly mistake because your customerfeedback analysis wasn’t on point? Well, you thought you had actionable insights, but then the end result was a big floparoo? That gold mine list of feedback turned into a mine field? Feedback alone isn’t fully actionable and usable.
Omnichannel analytics enable teams to get a 360 view of user behavior at different touchpoints of the customer journey. Analyzing customer journeys across all channels allows teams to remove friction that stops users from progressing down the funnel. Finally, act on the insights.
Ever found yourself getting loads of feedback, but didn’t have the customerfeedback system in place to do something with it all? Not only is it a mess for you, but it can also let your customers down when you don’t do something about their feedback. The customerfeedback system learning.
When it comes to the four pillars of product analytics maturity , collaboration is the part we on Mixpanel’s Customer Success team are asked about the most: “How can we improve our collaboration?” Self-serve insights. Although, complex analysis does not need to be completely separate from self-serve insights.
TL;DR This is a data specialist who translates raw data into actionable insights, acting as a bridge between numbers and business decisions. A business intelligence analyst gathers, cleans, and analyzes data to find trends, translating those insights into clear reports and visuals to empower data-driven decisions. Book a demo today!
Users have to stick around for a while so the app can learn their likes, dislikes, deal-breakers, and other information to help locate a compatible match. . The more questions we ask, the more information we receive, and the better we can pair users with someone else. Creating the Perfect Data Stack . BI and Amplitude: Better Together.
TL;DR A business intelligence (BI) analyst is a data specialist who helps businesses translate raw data into actionable insights. A business intelligence (BI) analyst is a data specialist who helps businesses translate raw data into actionable insights. Let’s dive in! Looking into tools for business intelligence analysts?
Tableau has been helping businesses to transform raw data into valuable insights for more than 16 years. You can also read our comparison articles of Reveal vs Sisense , Reveal vs Looker , Reveal vs Logi Analytics , and Reveal vs Power BI. The Pros of Tableau Embedded Analytics. The Cons of Tableau Embedded Analytics.
So he adapted his role – expanding into more of a bridge between insights, corporate strategy, and product strategy. I was creating a lot of dashboards, doing a lot of analytics - almost like an internal consulting role. On one hand, you’ve got the tactical aspect that would include something like dashboarding.
Best tools for product analysts Best tool for Product Analysis ( Userpilot ) : Userpilot gives you insight into your product performance and helps you understand user behavior. Best tool for Product Insights (Mixpanel) : Mixpanel helps you understand your customer experience and find out what works and what does not.
For marketing teams focused on getting more user traffic and signups, Google Analytics has been the tool of choice. But with customers spending more time researching and buying online, websites and product experiences are converging to accommodate customer needs, and the scope of analysis for most marketers is increasing.
The insight comes together to define the team culture one is joining and the best way to introduce any necessary changes. Suggested Approach Look over materials referenced during your first 30 and 60 days and identify areas where you now have questions and/or more insight would be beneficial.
TL;DR Self-service analytics is a business intelligence (BI) approach that empowers users to access, analyze, and interpret data without relying on IT or data teams. Difficulties driving cross-departmental user adoption. Collecting feedback and iterating on your self-serve analytics system. Let’s get started!
Experts predict the Customer Analytics market will top $24 billion by 2025. Organizations need customer data to provide the empathetic, personalized experiences customer demand—and to stay competitive. Organizations need customer data to provide the empathetic, personalized experiences customer demand—and to stay competitive.
Today, with insights from over 6,500 of you (thank you! Notion and Slack are the CRM and customer support surprises. And as you’ll see below in the section on switching tools, users aren’t happy about using Teams. Two hypotheses: People do not think highly of the Teams user experience. ” survey.
So you cant access or share valuable insights with others across the organization. Plus, such siloes also hinder collaboration, leading to fragmented insights and poor decision-making. Next, dig deeper into this data by capturing session replays , which enable you to focus on individual user behavior.
We organize all of the trending information in your field so you don't have to. Join 96,000+ users and stay up to date on the latest articles your peers are reading.
You know about us, now we want to get to know you!
Let's personalize your content
Let's get even more personalized
We recognize your account from another site in our network, please click 'Send Email' below to continue with verifying your account and setting a password.


Let's personalize your content