This site uses cookies to improve your experience. To help us insure we adhere to various privacy regulations, please select your country/region of residence. If you do not select a country, we will assume you are from the United States. Select your Cookie Settings or view our Privacy Policy and Terms of Use.
Cookie Settings
Cookies and similar technologies are used on this website for proper function of the website, for tracking performance analytics and for marketing purposes. We and some of our third-party providers may use cookie data for various purposes. Please review the cookie settings below and choose your preference.
Used for the proper function of the website
Used for monitoring website traffic and interactions
Cookie Settings
Cookies and similar technologies are used on this website for proper function of the website, for tracking performance analytics and for marketing purposes. We and some of our third-party providers may use cookie data for various purposes. Please review the cookie settings below and choose your preference.
Strictly Necessary: Used for the proper function of the website
Performance/Analytics: Used for monitoring website traffic and interactions
Introduction to customer satisfaction surveys Customer satisfaction surveys are vital tools for understanding what customers think, feel, and experience. Surveys provide a range of insights, from quick feedback after a purchase to in-depth assessments of brand loyalty. Don’t worry, we’ve got you.
Without effective UX analytics that goes beyond collecting data, you’re losing valuable customers. Unfortunately, the research backs this up, with a staggering 90% of usersreporting that they stopped using an app due to poor performance. Basically, anything that ruins the user experience.
Think of Net Promoter Score (NPS) software as a tool to measure your customers’ feelings about your product, and categorize them based on their level of loyalty (promoters, neutrals, and detractors). The great advantage of these tools is that they streamline the creation, distribution, and analysis of NPS surveys.
Let’s review everything your customer success team has to do in the absence of any customer success tools. Collect customerdata to calculate complex formulas for tracking metrics, monitor customer health scores, and resolve support tickets while continuously trying to improve retention and expansion.
Think your customers will pay more for datavisualizations in your application? But today, dashboards and visualizations have become table stakes. Discover which features will differentiate your application and maximize the ROI of your embedded analytics. Brought to you by Logi Analytics.
While “use data to drive decision-making” sounds obvious, there’s a HUGE gap between saying it and doing it well. So, how do you get started with product analytics ? In this article, we’ll talk about: What product analytics is and why you need a solid strategy. What is product analytics?
You can gather all the userfeedback or behavioral data you want or even generate tons of Google Analyticsreports. Despite all these efforts, you’re probably still not acting on product analytics correctly. Why actionable product analytics are important. But why bother fixing it?
Today, businesses are having more conversations with customers than ever before, thanks to the rise of business messengers. And it’s certainly easier than ever for a customer to start a conversation and get support. So businesses should know more about their customers than ever before, right?
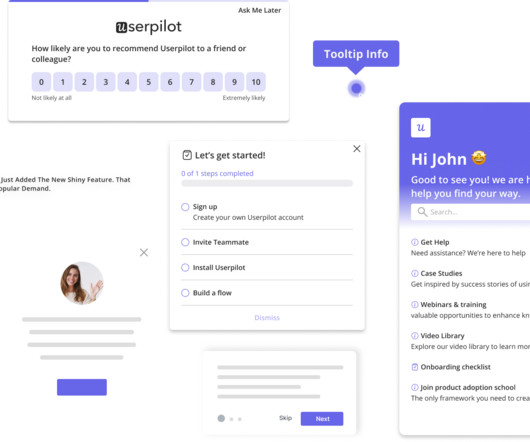
You see, although we work hard to make Userpilot the best product adoption tool on the market, we know it isnt the perfect fit for every business. You get something that truly works for you, and we get to connect with people who value what we offer and have the potential to become power users (and sources of sustainable revenue!).
This whitepaper discusses how automated business monitoring solutions like Yellowfin Signals revolutionize the way users discover critical and relevant insights from their data. Download to learn: 5 business benefits of automated data discovery with ABM. The evolution of dashboards to automated business monitoring.
In this digital-first world, understanding your customers’ experiences is more crucial than ever. To better understand the common challenges organizations face with digital feedbacktools, we conducted a comprehensive market research study that revealed several critical pain points.
You know your product collects tons of data. Datavisualizationtools help turn your messy spreadsheets into clear, interactive insights. The best ones dont even need SQL or data science skills. Because product analytics should be easy and accessible for everyone, not just data experts.
Ever wonder why some products instantly click with users while others get abandoned faster than New Year’s resolutions? The secret often lies in those crucial first moments – your user onboarding. But here’s the thing: getting users to say “wow” instead of “why?”
What if you could boost revenue without having to invest a small fortune in new customer acquisition? While it may sound too good to be true, the reality is that you can achieve this by implementing an effective customer expansion strategy. What is a customer expansion strategy? How to calculate customer expansion revenue?
Organizations look to embedded analytics to provide greater self-service for users, introduce AI capabilities, offer better insight into data, and provide customizable dashboards that present data in a visually pleasing, easy-to-access format.
Reveal Embedded Analytics For product owners, leveraging data is not just an advantageits a necessity. Product analytics empowers you to understand gaps in your offering and how users engage with your product. Both embedded analytics and product analytics are designed to help product owners in diverse ways.
Are you wondering how the new Userpilot customanalyticsdashboards can help you drive product growth? In this article, you will learn about the main benefits of custom product analyticsdashboards and how to create them in Userpilot. Userpilot is a robust analyticstool so you can use its own data.
Which product feedback software should you choose for your SaaS? The choice is tough because there’s no single tool that covers all use cases. What’s worse, you will find multiple tools in each category, making it incredibly difficult to pick the tool that satisfies your needs and offers the best value for money.
I’m going to take a wild guess and assume that you already understand the importance of mobile in-app feedbacktools. You might already have a Voice of the Customer (VoC) program in place that you’re looking to improve, or perhaps you’re just trying to get started. Now, more than ever, your customers want to be heard.
Speaker: Miles Robinson, Agile and Management Consultant, Motivational Speaker
So you want to set your product apart with the latest analytics, but you’re not sure where to start. How do you know what your customers want? You’ll leave with a better understanding of where to begin on creating actionable, insightfuldashboards. How to design your dashboard to solve your customers’ problems.
Reveal Embedded Analytics We know how difficult it is to create dashboards, especially for web applications. However, running business operations or targeted campaigns without insights into their effectiveness is not an option. Thats what dashboards are for. They track everything from user behavior to system performance.
Pro Tip: Pair your quick wins with data. A dashboard showing metrics like feature adoption or user engagement amplifies your credibility. Advanced Tactics: Stakeholder Mapping: Use tools like the Stakeholder Alignment Blueprint (available on jonihoadley.com) to identify key goals and concerns. Click here to download.
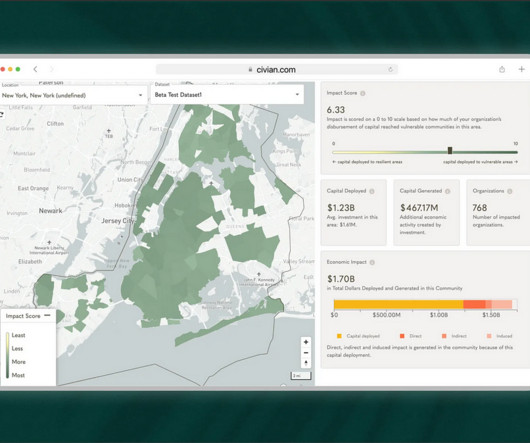
Case Study: Improving Data-Driven Decision Making for CSR Leadership Civian is a data-driven platform designed to help businesses measure, optimize, and showcase the social and economic impact of their investments in communities. Through our screening questions, we were able to tap into mirroring Civians user group quite accurately.
What happens when you build a product or service around what you think potential customers want, only for them to buy something else? For starters, it shows you dont know your customers well enough. But worse than that, it leads to lower revenue, failed products, and plummeting customer loyalty. The short answer: yes.
Speaker: Dean Yao, Director of Marketing at Jinfonet
What's the next big trend in analytics software and applications? You've probably used it without even knowing: embedded reporting and analytics. Software development teams more often now are embedding 3rd party analytics solutions into their products and applications to let them focus on other core areas of their software.
In SaaS, a customer onboarding dashboard can become a massive product analyticstool to understand and optimize the user journey. But what type of dashboards can you use to analyze your onboarding process? Let’s explore how a customer onboarding dashboard works and see different examples.
Customer intelligence (CI) data and insights are instrumental in product management. They also help create a personalized customer experience and improve product adoption. However, with so many customer intelligence tools available, how do you select the right one? Book a demo now to see it in action.
A high bounce rate might seem like lost interest, but what if users left because they couldnt find what they needed? Quantitative data alone doesn’t reveal intent, only outcomes. Thats why you need user session analysis. This reduces support costs, improves customer satisfaction, and accelerates the iteration cycle.
Now, more than ever, your customers want to be heard. They’re itching to give you feedback. Do you have the right tools to capture that voice? To help you with this, we compiled a list of the top mobile in-app feedbacktools of 2021. Mobile in-app feedbacktools & solutions.
Embedding dashboards and reports aren’t enough. Futureproof your application by offering instant, actionable insights that will give you and your customers a competitive advantage.
Are you struggling to make sense of scattered userdata? The right customeranalytics platform helps you uncover exactly how customers interact with your product: so you can spot issues early, optimize user journeys, and drive sustainable growth. Pendo – the best software for product-led insights.
Wondering how to build a customer success dashboard for your team? From the article, you will learn what a customer success dashboard is, why you need it, and what metrics it should include. And how to build a dashboard for your customer success team using Userpilot analytics !
Dataanalytics plays an instrumental role at every step of building a successful product. Whether you’re building your user base or releasing a new feature, the right no-code analytics platform can help you make evidence-based decisions. Many of these tools even come with AI capabilities. Let’s get right to it.
Customer Retention Rate (CRR) is a key business performance metric that measures the percentage of customers a company retains over a givenperiod. CRR formula, reference values andexample Customer Retention Rateformula Number of customers at the end of the period : Total number of customers at the end of the measuredperiod.
Soon after, a backlash followed, and users flooded social media with complaints. When users interact more, it may seem like a win. However, without qualitative feedback and behavioral insights, teams risk misreading signals, leading to frustration and churn. Userfeedback is valuable , but without data, its just opinions.
A key ingredient to build a better product is customerfeedback. There are various ways to collect customerfeedback that include customer surveys through sales executives, feedback forms, focused interviews, etc. How to gather relevant data??—?This This is a topic for another article.
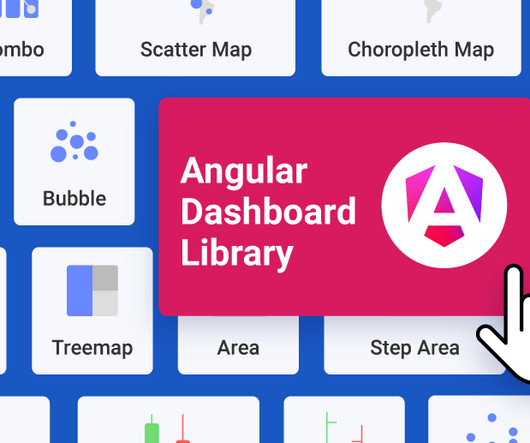
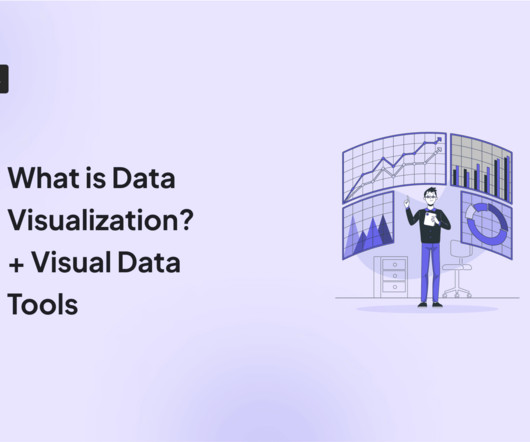
Visualdata surrounds us – colorful charts on weather reports, infographics on the web and in social media articles, map charts in presentations, etc. To help you get started with datavisualization, this article explores various visualization methods and their use cases. Funnel charts. Pie charts.
User experience can make or break a web app. If your software is slow or buggy, users wont stick around for long. If youre only finding out about these issues after users complain, youre already too late. Conversion funnel tracking : Analyzes where users abandon processes like the onboarding flow. The worst part?
Reveal Embedded AnalyticsData-driven companies have a hidden advantage! Theyve consistently outperformed their counterparts, reporting significantly higher metrics across operational efficiency (81% vs. 58%) , revenue growth (77% vs. 61%), and employee satisfaction (68% vs. 39%). How is this possible?
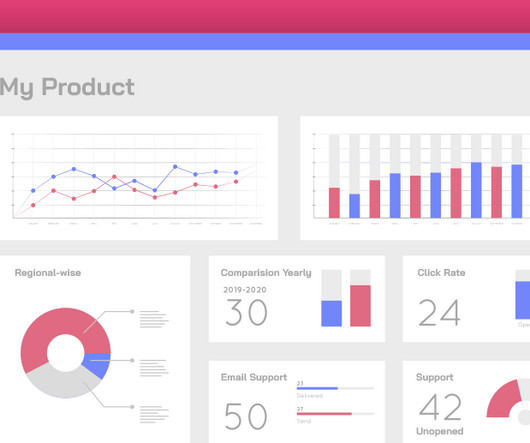
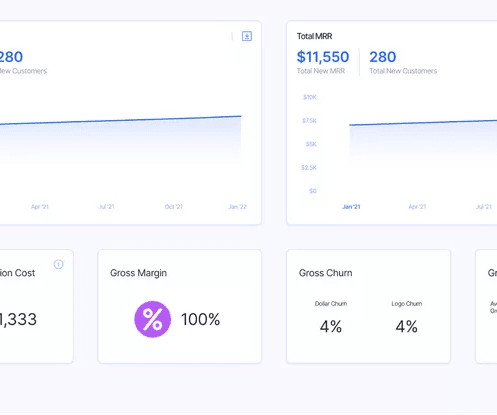
Would you like to learn how to design a SaaS metrics dashboard for your team without any coding? In the article, you will find examples of various SaaS dashboards and learn how to create them with Userpilot analytics. We also explain what metrics you may want to track and how to use the insights they offer.
Customerinsights enable SaaS teams to understand them better and build products that satisfy their genuine needs. From the article, you’ll learn about different kinds of customerinsights (from product analytics and only) and the benefits of gathering them. Let’s dive right in!
If you are a SaaS company, the chances are you’ve come across the term “self-serve analytics” at some point online. Unlike traditional data analysis methods, self-serve analytics equips everyone in your organization to explore data and take the right actions in real time. Choosing a good business intelligence tool.
In 2006, British mathematician Clive Humby made the infamous statement: Data is the new oil. Like oil, raw data needs to be refined, processed and turned into something useful because its value lies in its potential. Unfortunately, most people have yet to understand what it truly means to use data. moment that makes users stick.
Welcome to Product PickEm 2025 , where the best emerging product tool startups go head-to-head in a bracket-style competition, and YOU decide which ones rise to the top via our LinkedIn polls on the Productside page. Each round, the lowest-scoring tools get eliminated, and the best move forward. Forget the hype. Four winners.
We organize all of the trending information in your field so you don't have to. Join 96,000+ users and stay up to date on the latest articles your peers are reading.
You know about us, now we want to get to know you!
Let's personalize your content
Let's get even more personalized
We recognize your account from another site in our network, please click 'Send Email' below to continue with verifying your account and setting a password.


Let's personalize your content