This site uses cookies to improve your experience. To help us insure we adhere to various privacy regulations, please select your country/region of residence. If you do not select a country, we will assume you are from the United States. Select your Cookie Settings or view our Privacy Policy and Terms of Use.
Cookie Settings
Cookies and similar technologies are used on this website for proper function of the website, for tracking performance analytics and for marketing purposes. We and some of our third-party providers may use cookie data for various purposes. Please review the cookie settings below and choose your preference.
Used for the proper function of the website
Used for monitoring website traffic and interactions
Cookie Settings
Cookies and similar technologies are used on this website for proper function of the website, for tracking performance analytics and for marketing purposes. We and some of our third-party providers may use cookie data for various purposes. Please review the cookie settings below and choose your preference.
Strictly Necessary: Used for the proper function of the website
Performance/Analytics: Used for monitoring website traffic and interactions
Surveys provide a range of insights, from quick feedback after a purchase to in-depth assessments of brand loyalty. They are also inclined to recommend the brand to others. In marketing, they can gauge brand awareness, assess advertising effectiveness, or understand customer preferences.
A customer sentiment dashboard is a great way to visualize customer feedback and see what users love (or hate) about your product. But how do you collect the right data for your analysis? Customer sentiment dashboards help you generate the following: Sentiment trends over time. Sentiment distribution. Text response analysis.
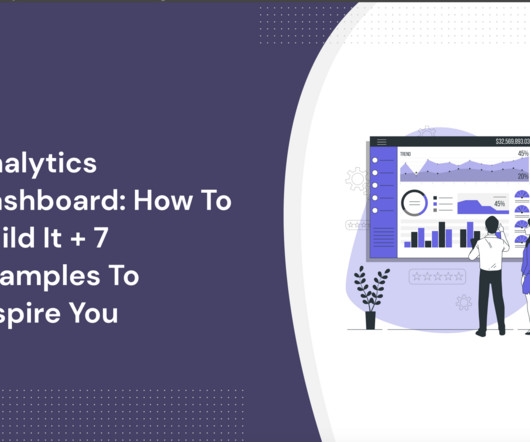
A product analytics dashboard helps you visualize user behavior, so you can make informed decisions on how to improve product engagement. In this article, we cover the following: Why you need an analytics dashboard. The types of metrics to track in your dashboard. The most common analytics dashboards in SaaS.
Reveal Embedded Analytics If you’ve ever struggled to create new dashboards with similar KPIs, integrations, and layouts but different data sources, this article is for you. What Are Dashboard Templates? Dashboard templates are pre-designed layouts that provide a framework for organizing and presenting data in a visual format.
Dashboard design can mean the difference between users excitedly embracing your product or ignoring it altogether. Great dashboards lead to richer user experiences and significant return on investment (ROI), while poorly designed dashboards distract users, suppress adoption, and can even tarnish your project or brand.
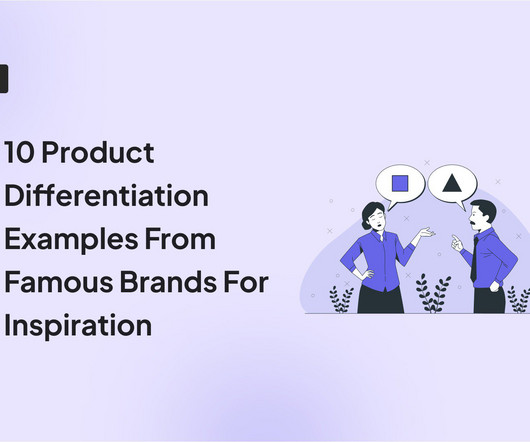
In this article, we’ll explore the types of product differentiation strategies and go over cases of real-world brands that have used these strategies to drive product growth. This process grants you a competitive advantage and fosters brand loyalty. Apple differentiates itself through brand image and reputation.
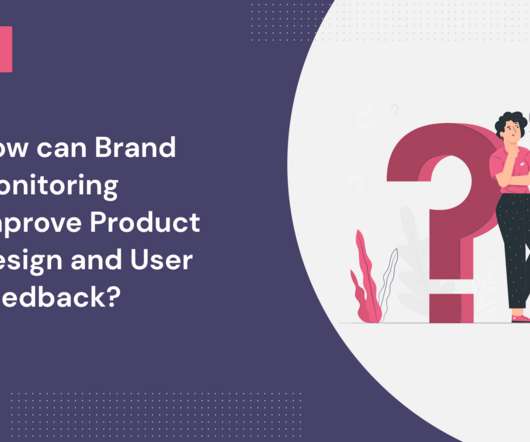
How do you get feedback on what new features to build next? Brand monitoring is a crucial part of any product’s development process. If you’re interested in learning more about how to better track and understand your customers’ thoughts on your product, read on! What is brand monitoring?
How to start your UX analysis. UX analytics involves gathering, analyzing, and interpreting data about how users interact with your product or service. Dashboard : Customize the analytics dashboard or choose from pre-built ones to easily visualize and compare key metrics over time. UX analytics tools worth considering.
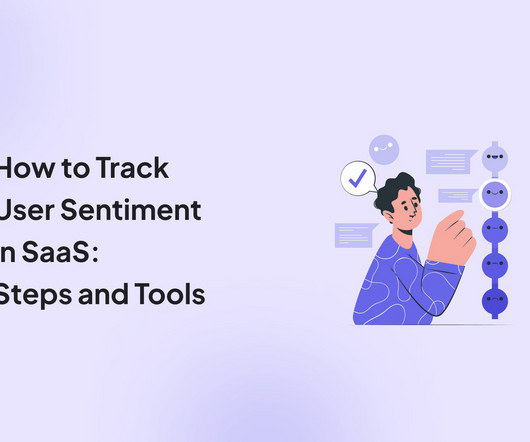
TL;DR User sentiment is the feeling a person has about your brand, product, or service quality. Brand24 – best for brand sentiment analysis. Book a demo now to learn how Userpilot helps you collect feedback data and analyze the sentiments behind it. Talkwalker- best natural language processing sentiment analysis tool.
mParticle is the customer data platform for brands leading the CX revolution. Our SDK is instrumented into mParticle, and when a mParticle customer decides to leverage Apptentive, a switch is flipped on in their dashboard which gives them immediate access to Apptentive. Mobile in-app feedback tools & solutions. Apptentive.
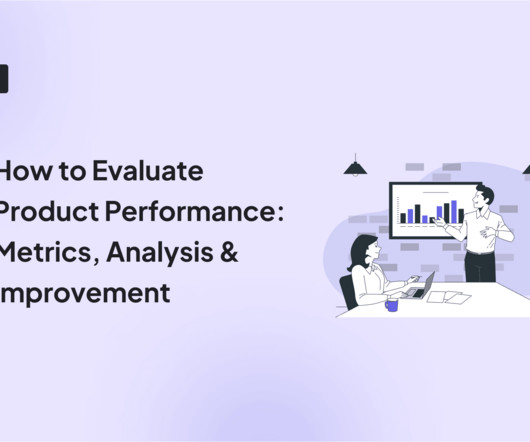
It’s no secret that learning how to evaluate product performance is essential for product management. But how can you effectively measure product metrics that can help you reach your goals and increase revenue growth? How to measure product performance? Here’s how you can measure product performance effectively: 1.
mParticle is the customer data platform for brands leading the CX revolution. Our SDK is instrumented into mParticle, and when a mParticle customer decides to leverage Apptentive, a switch is flipped on in their dashboard which gives them immediate access to Apptentive. How to collect more in-app feedback. Apptentive.
Most importantly, we’ll show you how to leverage them to create better product experiences. How to leverage customer insights: Gather qualitative and quantitative insights through surveys, interviews, and informal conversations to understand customer needs, preferences , and satisfaction levels. Book the demo to find out how!
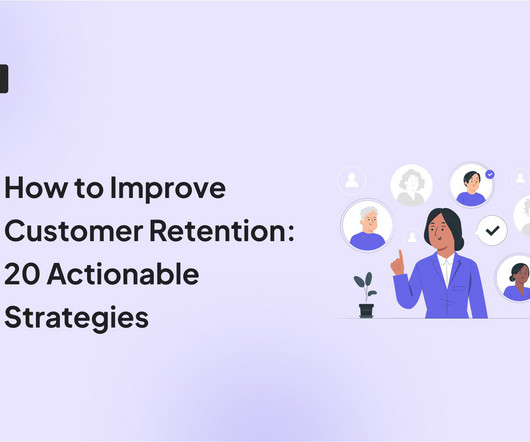
Wondering how to improve customer retention? You will also learn how to implement them with Userpilot! Foster an online brand community to increase loyalty and create competitive advantages. Create a customer retention analytics dashboard to measure success across key metrics. If so, we’ve got your back!
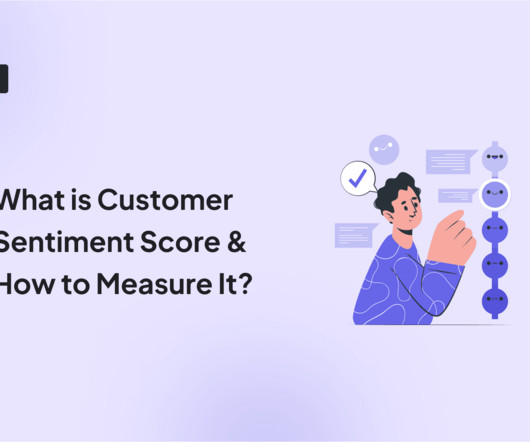
The customer sentiment score can help you tell how well-perceived your brand is. But how can you measure and improve it? Let’s explore the customer sentiment score, how to measure it with user feedback , and what strategies you can execute to elevate the customer experience. A good sentiment score varies by industry.
Taking into account the expanding usage of technologies in the financial industry, there is no wonder people started wondering how to make a fintech app. Although this term causes a lot of discussions, it isn’t a brand-new notion. Branding A mobile or web application will contribute a lot to your brand recognition.
Are you trying to develop a customer advocacy strategy for your SaaS but not sure how to go about it? You will find out what customer advocacy is, how it improves retention and other key metrics, and learn about different types of customer advocacy programs and how to build them. If so, this article is exactly what you need!
How to make sure that such software products are truly universal? If the process of organizing, planning, and controlling finances is smooth and swift, users will probably turn into the brand advocates. To increase working efficiency, users can tweak dashboards and choose the most topical tabs. COP (Colombian pesos)!
That painful choice ends today as we unveil an array of new features that range from advanced ticketing workflows to new Inbox views, from beefed-up Reporting dashboards to sophisticated asynchronous support. Naturally, you might be nervous about how to meet those expectations, or wondering how to keep them in check.
With white-label analytics , your customers get access to dashboard/reporting customized to your current applications experience. White-labeling is the ability that most analytics vendors nowadays offer, which allows customers to match the branding in your current application. Custom dashboard and reporting capabilities.
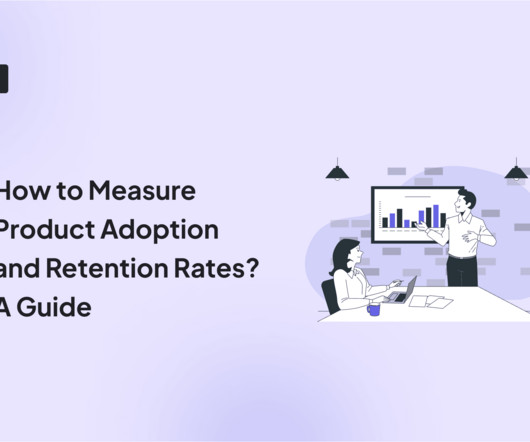
Wondering how to measure product adoption and retention rates? Read to find out what product adoption and retention metrics to track, how to analyze the data for actionable insights, and how Userpilot can help you. You can also create custom dashboards with up to 30 reports. If yes, this article is exactly what you need!
E.g., Identify navigation issues in your analytics dashboard based on real-time user interactions. Userpilot is one answer, offering data collection and analytics features for quantitative and qualitative data, along with a custom analytics dashboard for visualizing your unique data and responses.
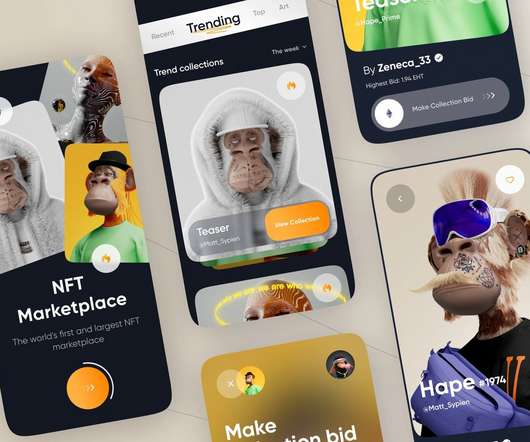
NFT dashboard/Storefront The NFT dashboard is a display for all the digital assets in the marketplace, open for the users to trade them. A number of the items accessible in the dashboard are the NFT price list, NFT description, NFT Categories, etc. The blog discussed is just the tip of the iceberg. Strap up and get developing!
Learn how to use and read paths. This means using the welcome survey discussed above to learn what users expect from your brand. Gamification involves integrating game mechanics like challenges, rewards, and feedback to boost enthusiasm for your brand. A deep sense of loyalty to your brand ! Not sure how to prioritize?
Looking to track and improve customer sentiment for your brand? TL;DR Customer sentiment is the overall feeling your customers have about your brand. How to conduct customer sentiment analytics: Get equipped with the right customer sentiment analysis tools. Actionable strategies for improving customer sentiment.
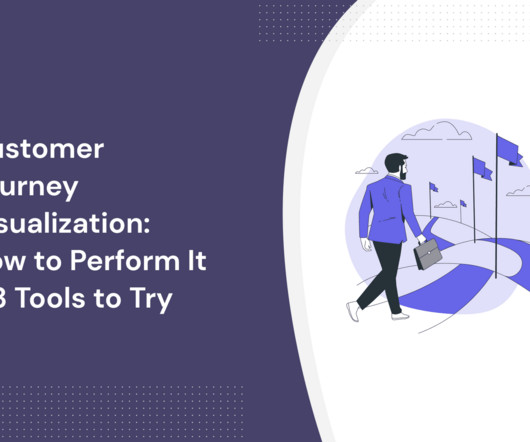
TL;DR A customer journey map represents the steps users take when interacting with your brand. A customer journey map is a visual representation that illustrates the steps your customers go through when engaging with your brand. Here’s how to approach it: 1. You can also build custom dashboards.
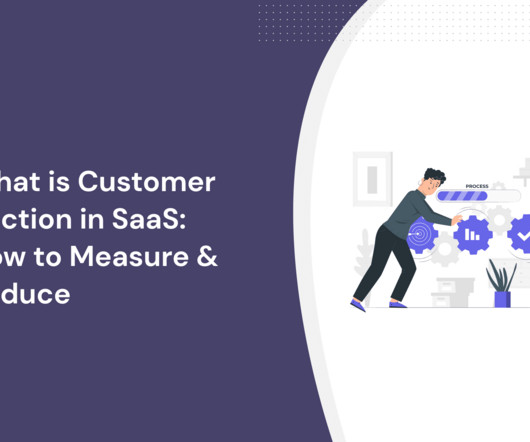
In the article, we show you how to identify and reduce customer friction in your SaaS product to boost product engagement. It also enhances customer experience and boosts customer satisfaction , which are priceless for reducing churn and building brand loyalty. Reducing friction fosters product and brand loyalty.
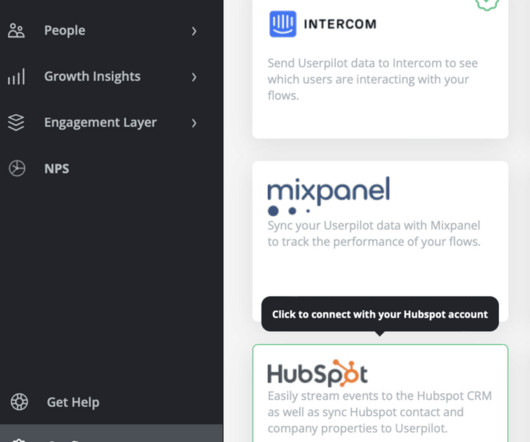
You can enhance HubSpot’s custom reports and dashboards with product and user behavior data tracked in Userpilot to gain a comprehensive understanding of customer needs and preferences. All the data is relayed in real-time so all the reports and dashboards will be up-to-date. Hubspot custom dashboard.
Practical tips and examples of onboarding designed by some top SaaS brands. This is especially true when they’re used during signup to show dashboard screenshots, positioning messages, etc. Asana uses customer data to create personalized dashboards and ease the user journey. SaaS onboarding process. Collect relevant data.
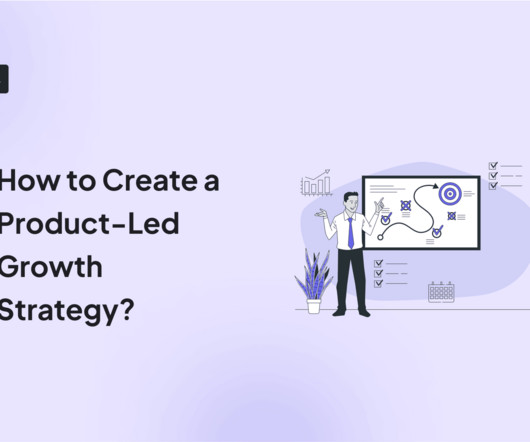
Learning how to create a product-led growth strategy can transform your business. Marketing-led growth focuses on expanding brand awareness and generating leads through content and ads. Focusing on the product and its value leads to a better experience for users, which can result in increased customer satisfaction and brand loyalty.
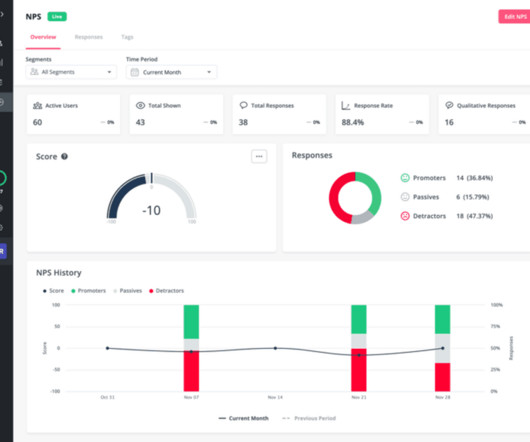
In this article, we’ll learn more about customer needs, conducting customer needs analysis, and how to gain insights from it with a tool. Userpilot can help you perform customer needs analysis with in-app surveys, advanced segmentation options, and an NPS dashboard. And also how you can improve your product to be more attractive.
Understanding how to analyze survey data doesn’t have to be complicated. With the right survey questions, you can gain insights into what your customers like and dislike about your brand, products, and services. For instance, the NPS dashboard gives you access to all relevant NPS survey data. Book a demo today!
To overcome barriers to success in the industry, teams within gaming companies need to look beyond the immediate moment — to work smarter, not harder , to uncover timeless stories that build brand equity while contributing to valuable growth metrics. That means making sure that your data is easy for anyone at your company to understand.
For a consistent brand image, all of your marketing activities should communicate and reinforce this one statement. Know which metrics matter most—and how to measure and grow them. DESIGN A DASHBOARD FOR RECORDING AND ANALYZING YOUR METRICS AND KPIS. CONTINUE TO ADD TO YOUR PERFORMANCE DASHBOARD. Five-star ratings?
How NPS is calculated. NPS survey dashboard in UsrGuiding tool. But in reality, every redesign, no matter how brilliant it is, will likely cause negative feedback from yourusers. Meet our brand new design. They might complain simply because they have to invest their time to learn how to deal with a new design.
In this article, we will discuss everything you need to know about NPS follow-up questions, examples, best practices, and how to create one. Some best practices for creating NPS follow-up questions include personalizing the follow-up questions, using branding colors, localizing the question, and adding a “Thank You” page.
It begins with the first customer interaction and continues in-app past the activation point until the user becomes a brand advocate. Book a Userpilot demo to learn how it helps you improve engagement and drive customer satisfaction. Think of it as a model that determines how and where you communicate with your (target) customer.
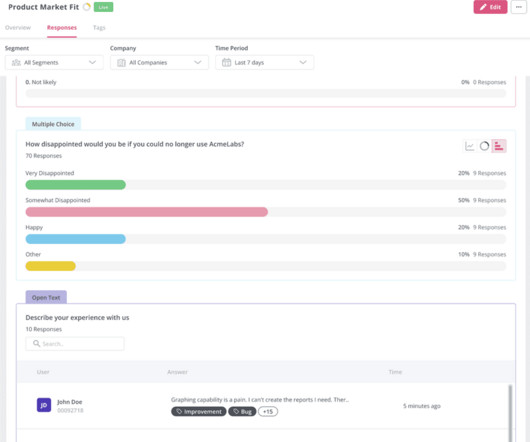
You can interpret survey responses using survey analytics dashboards to visualize data, response tagging to discover feedback trends, and cross-referencing results with behavioral data to better understand user interactions. How to collect data for survey analytics? How to interpret survey responses? What is survey analytics?
Wondering how to measure Martech's success? If you’d like to learn how to track these metrics (and optimize them) with Userpilot, book the demo! Market penetration and brand visibility. How to measure Martech success: Customer activation rate. How to measure Martech success: Core feature adoption rate.
Do you want to learn how to use data analytics to improve customer experience? In this guide, we’re going to show you how to use data analytics to improve the customer experience! Increased customer loyalty is a major competitive advantage so building brand loyalty by increasing satisfaction scores should always be a priority.
The post Beyond launch day: How to plan successful B2B product rollouts appeared first on Mixpanel. Also, heavily use View Users to reach out to power users and get feedback/ customer stories for marketing content. Learn more about using Mixpanel’s reporting and analytics in your next product rollout— request a demo today.
With various methods and best practices flying around, you might be wondering how to collect customer feedback for your SaaS in the best way possible. It enables you to collect user insights with in-app surveys and analyze them with an intuitive dashboard. Let’s dive right in! Source: Mailchimp. Survey triggering in Userpilot.
Geoffrey Keating: Let’s take a hypothetical example: say you’re launching a brand new product tomorrow. What are the first steps you’re taking to understand how to position it? We want to be the company that sales leaders come to for insights and advice on how to modernize their sales organization.
Are you overwhelmed by the sheer volume of customer data and unsure how to analyze it effectively? But how do you determine how different segments behave and which are most valuable to your business? Funnel report View how your segments behave across the funnel. Walkthrough of how to build a funnel analysis in Userpilot.
We organize all of the trending information in your field so you don't have to. Join 96,000+ users and stay up to date on the latest articles your peers are reading.
You know about us, now we want to get to know you!
Let's personalize your content
Let's get even more personalized
We recognize your account from another site in our network, please click 'Send Email' below to continue with verifying your account and setting a password.


Let's personalize your content