This site uses cookies to improve your experience. To help us insure we adhere to various privacy regulations, please select your country/region of residence. If you do not select a country, we will assume you are from the United States. Select your Cookie Settings or view our Privacy Policy and Terms of Use.
Cookie Settings
Cookies and similar technologies are used on this website for proper function of the website, for tracking performance analytics and for marketing purposes. We and some of our third-party providers may use cookie data for various purposes. Please review the cookie settings below and choose your preference.
Used for the proper function of the website
Used for monitoring website traffic and interactions
Cookie Settings
Cookies and similar technologies are used on this website for proper function of the website, for tracking performance analytics and for marketing purposes. We and some of our third-party providers may use cookie data for various purposes. Please review the cookie settings below and choose your preference.
Strictly Necessary: Used for the proper function of the website
Performance/Analytics: Used for monitoring website traffic and interactions
Without effective UX analytics that goes beyond collecting data, you’re losing valuable customers. Unfortunately, the research backs this up, with a staggering 90% of users reporting that they stopped using an app due to poor performance. It covers key topics, such as: Defining UX analytics. What is UX analytics?
Featuring an engaging discussion with Inis Hormann (Marketing Director Germany, Cepheid) and Steve Kury (Leadership Development Consultant, SHK Leadership Consulting), the session provided actionable insights for PMs at every level. Leverage Data: Use findings to guide decisions, reduce uncertainty, and inform future product iterations.
Using a custom ChatGPT model combined with collaborative team workshops, product teams can rapidly move from initial customer insights to validated prototypes while incorporating strategic foresight and market analysis. Instead of focusing solely on today’s customer problems, product teams need to look 2-5 years into the future.
Think of Net Promoter Score (NPS) software as a tool to measure your customers’ feelings about your product, and categorize them based on their level of loyalty (promoters, neutrals, and detractors). The great advantage of these tools is that they streamline the creation, distribution, and analysis of NPS surveys.
Speaker: speakers from Verizon, Snowflake, Affinity Federal Credit Union, EverQuote, and AtScale
Join this webinar panel for practical advice on how to build and foster a data literate, self-serviceanalysis culture at scale using a semantic layer. In this webinar you will learn about: Making data accessible to everyone in your organization with their favorite tools.
Introduction to customer satisfaction surveys Customer satisfaction surveys are vital tools for understanding what customers think, feel, and experience. Surveys provide a range of insights, from quick feedback after a purchase to in-depth assessments of brand loyalty. Don’t worry, we’ve got you.
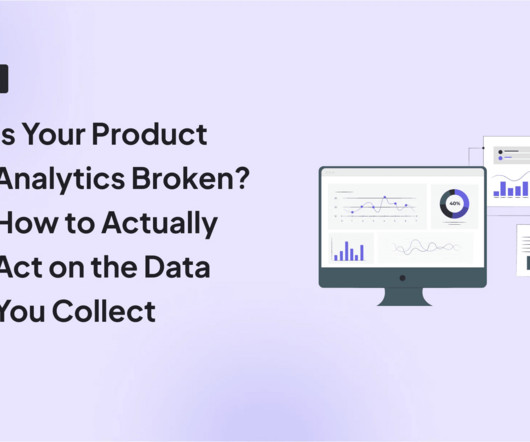
You can gather all the user feedback or behavioral data you want or even generate tons of Google Analyticsreports. Despite all these efforts, you’re probably still not acting on product analytics correctly. Why actionable product analytics are important. This causes siloed data and integration issues.
Let’s review everything your customer success team has to do in the absence of any customer success tools. Collect customer data to calculate complex formulas for tracking metrics, monitor customer health scores, and resolve support tickets while continuously trying to improve retention and expansion.
Drawing from his 20+ years of technology experience and extensive research, Nishant shared insights about how these activities vary across different organizational contexts – from startups to enterprises, B2B to B2C, and Agile to Waterfall environments.
The world of BI and analytics has evolved. Discover the five styles of reporting and analysis, and learn the pros and cons of each in an enterprise scenario.
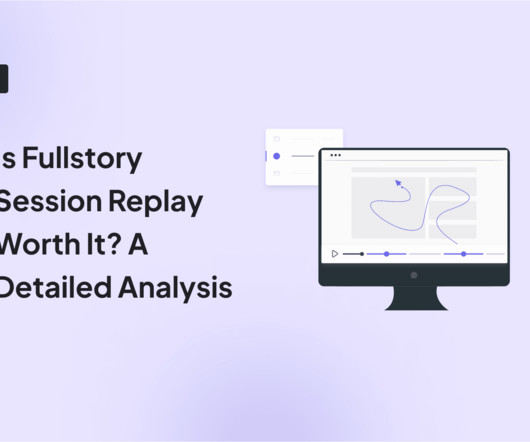
Are you looking for a session replay tool but not sure if Fullstory is the right option for your SaaS? The tool’s pros and cons. Pinpoint bug locations by linking user sessions to bug reports or customer tickets. Thanks to this, you can hone in on the most relevant session recordings for focused analysis.
This unique combination developed both her analytical thinking skills and her ability to question assumptions – capabilities that would later prove valuable in her product career. Over ten years, she rose through the ranks until everyone in the company reported to her.
How product managers can use AI to get more actionable insights from qualitative data Today we are talking about using qualitative data to drive our work in product and consequently improve sales. ” Then the product leader goes to some poor associate PdM and asks them to collate all of the data together. .”
Well, it’s not quite that simple – despite the influx of customer conversations, it can be hard to derive meaningful insights from all that data. Identifying the right insights is key to operating at scale while keeping your customer experience personal, but it’s a huge challenge to find the signal in the noise.
Speaker: Evan Leong - CEO & Founder, Product Signals
How do industry leaders like Apple and Amazon successfully leverage customer and market insights to enhance their products, even with vast customer bases and extensive market data? Despite its significance, many organizations struggle to collect and utilize feedback appropriately.
You know your product collects tons of data. Datavisualizationtools help turn your messy spreadsheets into clear, interactive insights. The best ones dont even need SQL or data science skills. Because product analytics should be easy and accessible for everyone, not just data experts.
Reveal Embedded Analytics For product owners, leveraging data is not just an advantageits a necessity. Product analytics empowers you to understand gaps in your offering and how users engage with your product. Both embedded analytics and product analytics are designed to help product owners in diverse ways.
As you might know, session replay tools track every click, scroll, and hiccup from your usersjust as if you were watching through their eyes. They allow you to close the gap between your analyticsdata and the feedback you get from users. But with so many session replay tools, which ones are worth your time and money?
You see, although we work hard to make Userpilot the best product adoption tool on the market, we know it isnt the perfect fit for every business. Robust resource center functionalities for offering self-service help. Custom dashboards to track key metrics at a glance. for collecting user sentiment data.
Quantitative data alone doesn’t reveal intent, only outcomes. Thats why you need user session analysis. By combining contextual insights from session replays , heatmaps, and behavior analytics, user session analysis helps you interpret metrics through the lens of real user journeys.
A Brief Introduction to Thomas’s Work: What Is Intelligence Analytics and the Dark Web? Thomas Groendal is the Senior Product Manager at Bluestone Analytics , a subsidiary of CACI , a $6 billion company that focuses on intelligence analysis. What exactly is intelligence analysis? You can submit your story here.
The collaboration between AMS and MIT researchers has yielded impressive results, with AI tools not only matching human analysts in identifying customer needs but often exceeding themespecially for emotional needs that humans might overlook. But it is changing, with AI tools that are transforming how we uncover and analyze customer needs.
A customer expansion strategy is a playbook for increasing the revenue from your existing customers, for example, by selling them additional products and services or encouraging them to upgrade to higher plans. As your team grows and you hire new people or other departments adopt the tool, the number of seats needed increases.
Think your customers will pay more for datavisualizations in your application? But today, dashboards and visualizations have become table stakes. Discover which features will differentiate your application and maximize the ROI of your embedded analytics. Brought to you by Logi Analytics.
Proactive Problem Solving Doug was motivated to write Proactive Problem Solving by two pieces of data showing the impact of reactive problem solving: The average manager wastes 3.5 These principles aren’t just theoretical – they’re practical tools that any product team can implement to enhance their innovation process.
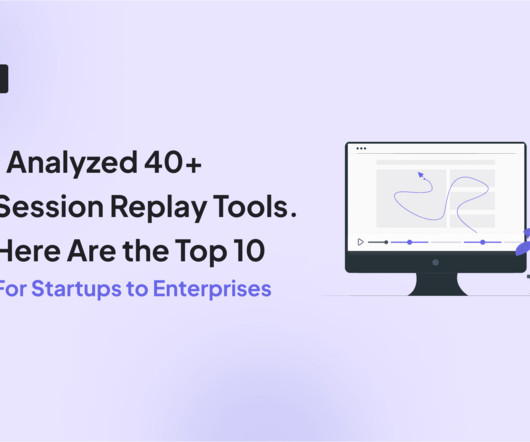
We’ve researched, tested, and curated a list of 10 top-rated session recording tools to help you unlock valuable user insights and build better digital experiences. Microsoft Clarity – Suitable for SMBs with no heavy analytics needs – 100% free. This article aims to simplify the decision-making process.
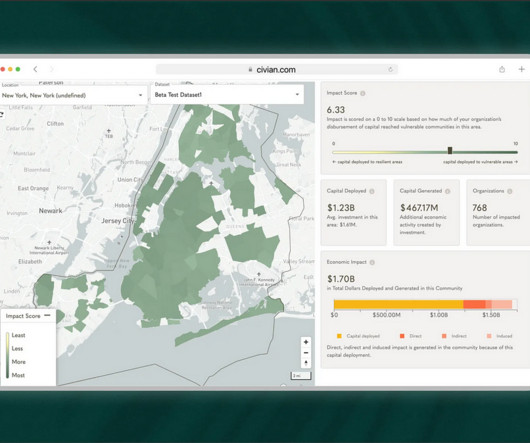
Case Study: Improving Data-Driven Decision Making for CSR Leadership Civian is a data-driven platform designed to help businesses measure, optimize, and showcase the social and economic impact of their investments in communities. Feature Engagement Users most frequently gravitated toward the map to explore and compare data.
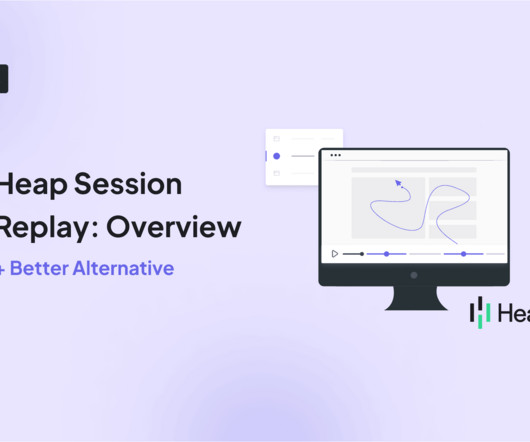
Heap is one of multiple analyticstools that offers session replay functionality. I will show you how it works, discuss its main capabilities and limitations, and suggest an alternative session recording tool to consider. Other tools, like Hotjar, have caught up with Heap and offer this kind of functionality, too.
Speaker: Speakers from SafeGraph, Facteus, AWS Data Exchange, SimilarWeb, and AtScale
Data and analytics leaders across industries can benefit from leveraging multiple types of diverse external data for making smarter business decisions. Data and analytics specialists from AWS Data Exchange and AtScale will walk through exactly how to blend and operationalize these diverse data external and internal sources.
Can you create opportunities from sales conversations, support tickets, feature requests, or behavioral analytics? Tools & Templates What tool should you use to create an opportunity solution tree? Opportunity solution trees are a simple way of visually representing the paths you might take to reach a desired outcome.
Note that Ive decided not to state the names of the tools I found, partly as the AI landscape is changing rapidly and partly as you should research and select the tools that work best in your context rather than trusting my judgment. [2] 2] Market Research AI-based tools can discover user and customer trends using predictiveanalytics.
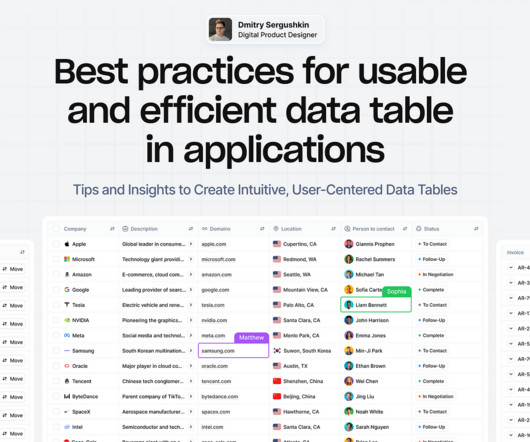
Tips and Insights to Create Intuitive, User-Centered DataTables Data tables provide a structured way to organize and manage information, making it easier to analyze and visualizedata effectively. However, creating effective data tables is not as simple as organizing rows and columns.
Are you struggling to make sense of scattered user data? The right customer analytics platform helps you uncover exactly how customers interact with your product: so you can spot issues early, optimize user journeys, and drive sustainable growth. Choose the best fit for your needs and transform data into actionable strategies.
Download this whitepaper to learn what contextual analytics is, how BI platforms like Yellowfin revolutionize the way users discover insights from their data with native contextual analytics, and how it adds value to your software solution by elevating the user experience.
The choice is tough because there’s no single tool that covers all use cases. What’s worse, you will find multiple tools in each category, making it incredibly difficult to pick the tool that satisfies your needs and offers the best value for money. Which product feedback software should you choose for your SaaS?
I’m going to take a wild guess and assume that you already understand the importance of mobile in-app feedback tools. You also might be reading this post thinking: “Who’s adding new tools to their tech stack right now?” Do you have the right tools to capture that voice? Mobile in-app feedback tools & solutions.
However, without qualitative feedback and behavioral insights, teams risk misreading signals, leading to frustration and churn. User feedback is valuable , but without data, its just opinions. To eliminate these blind spots, you need to combine quantitative, qualitative, and visualdata. How to collect each data type.
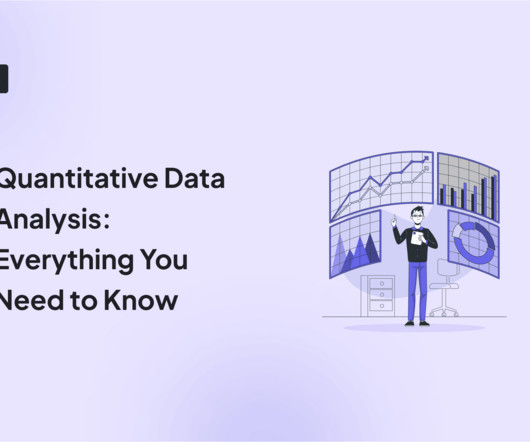
Does the thought of quantitative dataanalysis bring back the horrors of math classes? But conducting quantitative dataanalysis doesn’t have to be hard with the right tools. Want to learn how to turn raw numbers into actionable insights on how to improve your product? Collecting and cleaning data.
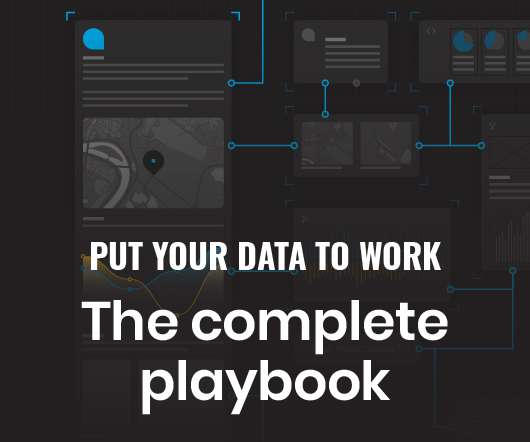
An interactive guide filled with the tools to turn your data into a competitive advantage. They rely on data to power products, business insights, and marketing strategy. This playbook contains: Exclusive statistics, research, and insights into how the pandemic has affected businesses over the last 18 months.
During the third stage, input is analyzed and during the fourth stage, the insight gained from analysis is used to make decisions. Plugging in: how to generate insightsAnalysis: how to prioritize and understand feedback Communication: how to synthesize information Test/Build/etc & then repeat. Get Insights.
Think about all the insights you could gather to improve the user experience. By showing how users interact with different elements on the page or product screen, session replays provide product teams , designers, and marketers with valuable insights into user behavior. Every click, scroll, hover, or keystroke?
But if you have a breather, we’re excited to share some data-backed mobile engagement findings, specifically surrounding how seasonality impacts customer sentiment! While we can hypothesize that the lack of Vitamin D certainly contributes to grumpier customers in the gloomier months, we needed data to support our claims.
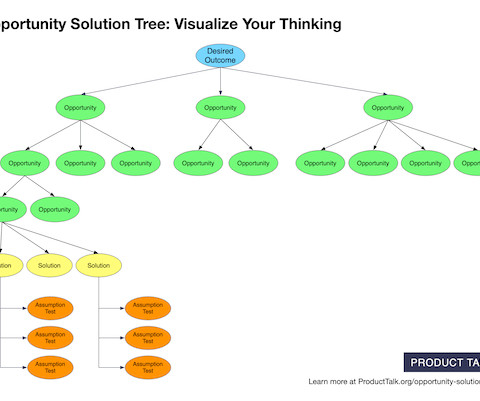
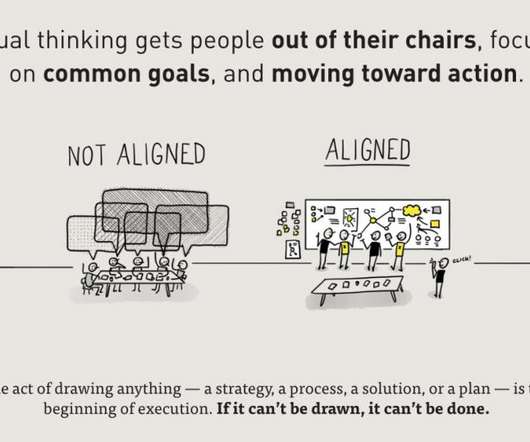
This definition is a mouthful, so I like to visualize it. I’m going to walk through this visual quickly, and then Cecilie and I are going to dive into this in more depth. Using the Opportunity Solution Tree to Guide Discovery The visual at the center of this is called an opportunity solution tree. It’s that simple.
Speaker: Eric Feinstein, Professional Services Manager, Looker
For a long time, Product Managers have found it challenging to design interfaces inside their products that users could use for reporting. It seems like PMs and engineers have grown to hate embedded reporting. How to evaluate embedded analytic solutions as strategy to greatly reduce initial and on-going engineering effort.
We organize all of the trending information in your field so you don't have to. Join 96,000+ users and stay up to date on the latest articles your peers are reading.
You know about us, now we want to get to know you!
Let's personalize your content
Let's get even more personalized
We recognize your account from another site in our network, please click 'Send Email' below to continue with verifying your account and setting a password.


Let's personalize your content