This site uses cookies to improve your experience. To help us insure we adhere to various privacy regulations, please select your country/region of residence. If you do not select a country, we will assume you are from the United States. Select your Cookie Settings or view our Privacy Policy and Terms of Use.
Cookie Settings
Cookies and similar technologies are used on this website for proper function of the website, for tracking performance analytics and for marketing purposes. We and some of our third-party providers may use cookie data for various purposes. Please review the cookie settings below and choose your preference.
Used for the proper function of the website
Used for monitoring website traffic and interactions
Cookie Settings
Cookies and similar technologies are used on this website for proper function of the website, for tracking performance analytics and for marketing purposes. We and some of our third-party providers may use cookie data for various purposes. Please review the cookie settings below and choose your preference.
Strictly Necessary: Used for the proper function of the website
Performance/Analytics: Used for monitoring website traffic and interactions
Thanks to this, you can hone in on the most relevant session recordings for focused analysis. Other analytics features, like funnels , custom dashboards, page flow analytics, segmentation, or trends, are available as add-ons. Strong collaboration tools for team-wide analysis. Trends and Retention Analysis. Autocapture.
Thats why you need user session analysis. By combining contextual insights from session replays , heatmaps, and behavior analytics, user session analysis helps you interpret metrics through the lens of real user journeys. Session analysis bridges this gap by showing you how users interact with your product in a real context.
To read more about this and how you can elevate your CX strategy in the future, download our Quick Guide to Transforming Your CX Strategy with Open Text Analysis! Automating Data Collection and Analysis Modern survey tools automate data collection and analysis, enabling efficient feedback gathering without manual labor.
This article will help reduce such churn by refining your product management and UX analysis approach. How to start your UX analysis. UX analysis benefits product managers by providing data-driven insights to guide product development decisions and prioritize features. Quantitative data used to be enough for UX analysis.
In SaaS, a customer onboarding dashboard can become a massive product analytics tool to understand and optimize the user journey. But what type of dashboards can you use to analyze your onboarding process? Let’s explore how a customer onboarding dashboard works and see different examples.
A customer sentiment dashboard is a great way to visualize customer feedback and see what users love (or hate) about your product. But how do you collect the right data for your analysis? Customer sentiment dashboards help you generate the following: Sentiment trends over time. Text response analysis.
When it comes to product management, you need to look at different SaaS dashboard examples to see what kind of product analytics you can measure, and how. So what are the most important types of dashboards and which ones are the best for you? A SaaS (software-as-a-service) dashboard is a centralized interface within your app.
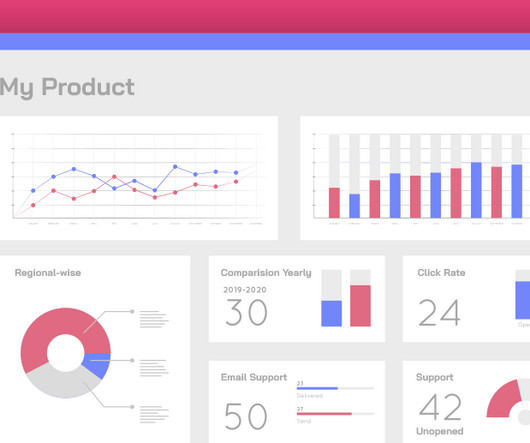
With an abundance of product analytics to track, having a robust SaaS KPI dashboard is essential to monitor the metrics that matter most. This guide will walk you through what it is, why you need one, and how to build your very own dashboard. TL;DR A SaaS dashboard can be used to track important metrics and key performance indicators.
But today, dashboards and visualizations have become table stakes. Think your customers will pay more for data visualizations in your application? Five years ago they may have. Discover which features will differentiate your application and maximize the ROI of your embedded analytics. Brought to you by Logi Analytics.
Often due to analysis paralysis , overwhelming amounts of information, or a lack of clear insights that drive product decisions. With the product usage dashboard, you can track user engagement metrics, popular pages and features, top interactions, trends, and even browser preferences. And the concept of diminishing returns sets in.
Wondering how to build a customer success dashboard for your team? From the article, you will learn what a customer success dashboard is, why you need it, and what metrics it should include. And how to build a dashboard for your customer success team using Userpilot analytics ! Populate your dashboard with up to 30 reports.
Thats where root cause analysis (RCA) comes in. How to carry out root cause analysis in 7 steps Look, RCA isnt some globally normalized process that must be followed to the teeth. Path analysis. Funnel analysis. Conducting funnel analysis with Userpilot. Looking for a Platform to Help You with Root Cause Analysis?
As you’re researching dashboard reporting tools, you’ve probably noticed how hard it is to find reliable information on the available solutions. To make your life a little bit easier and help you choose the best dashboard analytics tool for your SaaS, we’ve produced a guide of 12 excellent platforms available on the market in 2024.
Does the thought of quantitative data analysis bring back the horrors of math classes? But conducting quantitative data analysis doesn’t have to be hard with the right tools. TL;DR Quantitative data analysis is the process of using statistical methods to define, summarize, and contextualize numerical data. Get a demo.
In this article, we’ll explore some key metrics, analysis techniques, as well as actionable strategies to track and enhance your product performance. TL;DR Product performance analysis involves evaluating and measuring a product’s effectiveness, usage , and impact using various analytics tools.
In SaaS, a new user activation dashboard can become a massive product analytics tool to understand and optimize the user journey. But how can a dashboard for user activation can help you engage more users? What is a new user activation dashboard? moment ," impacting user retention and satisfaction.
Reports & analytics : Provide tailored analytics, dashboards, and reporting capabilities to track customer engagement, identify trends , and enable data-driven decision-making for improved customer success. Reporting and dashboards for outcome tracking. Reporting and dashboards for keeping a real-time pulse on customer sentiment.
A product adoption dashboard helps you visualize key adoption metrics so you can make data-driven decisions and boost user engagement. In this article, we cover the following: Why you need a product adoption dashboard. Steps to measure adoption using a comprehensive dashboard. Build your dashboard or use a template.
Custom dashboards to track key metrics at a glance. Pendo The dashboard on Pendo. Additional reports: You get a built-in Product Engagement Score dashboard. Lack of templates: There arent many ready-to-use dashboards or templates to get started quickly. UserGuiding dashboard. for collecting user sentiment data.
The great advantage of these tools is that they streamline the creation, distribution, and analysis of NPS surveys. Plus, the ability to create custom NPS dashboards allow you to analyze the results easily without writing a line of code. Leverage AI-driven sentiment analysis to analyze and categorize open-ended responses quickly.
You can do it by conducting a path analysis , which is a visualization of all user activities leading up to an event. Path analysis in Userpilot. For example, the lowest plan of an analytics tool may offer only basic reports, like funnels , while more advanced ones, like attribution analysis, could be included in the higher plans.
Looking for a customer behavior analysis example to see how you can extract valuable insights? In this article, you will also learn how to conduct customer behavior analysis step-by-step and how Userpilot analytics can help. To gain meaningful insights, the analysis should focus on specific user segments.
Product feature analysis is a powerful tool in the SaaS product manager’s arsenal. This article aims to simplify feature analysis. A step-by-step process for effective feature analysis. This analysis isn’t exclusive to SaaS; the principle applies when analyzing physical attributes for hardware products.
For the past decade, in nearly every conference, the #1 problem cited by analysts and their managers has been the same: their team built the best possible model (read: analysis, dashboard, report, predictive model) but people are not using it. Why are they requesting that dashboard, analysis, or model? So don’t build it.
Carrying out a competitive analysis can give your product an edge that may disrupt your industry and impact your bottom line. This article will help you conduct your own by providing you with a competitive analysis example and some templates. If you need to collect customer feedback to aid your competitive analysis, consider Userpilot.
What’s more, conversation topics also uses powerful machine-learning analysis of your customer conversations to generate suggested topics for you to explore, ensuring you get a deep understanding of the various topics of concern to your customers. With custom reports, now you can track industry-standard metrics beyond pre-built dashboards.
Data analysis is integral to a product manager’s job – it’s what helps them build impactful products. This article dives deep into data analysis for product managers. User data analysis helps: Provide direction for product development , allowing for effective resource allocation. Book a demo now to discuss your needs.
Deeper Insights through Integrated Data With the Alchemer Mobile API, you can fetch metrics already available within your Dashboard, as well as raw data such as responses and conversations. The post Introducing Alchemer Mobile API: Empowering Deeper Analysis, Secure Key Management, and Cross-App Insights appeared first on Alchemer.
When selecting a funnel tool, look for customization, integrations, segmentations , and dashboard options. When done right, funnel analysis helps you understand how users move from one stage of the journey to another. Funnel analysis in Userpilot. You can also identify points of friction as users drop off.
Having funnel analysis tools that provide comprehensive analytical insights about where and why users drop off will solidify your business’s competitiveness in the long term. TL;DR Funnel analytics refers to the analysis of events across all stages of every customer journey. Freemium with paid pricing available on request).
Customer segmentation analysis allows you to break down your users into distinct groups and gain valuable insights into them. In this article, you’ll learn about various types of customer segments you can identify and how to conduct a thorough analysis using the right product analytics tools. . Take action based on the analysis.
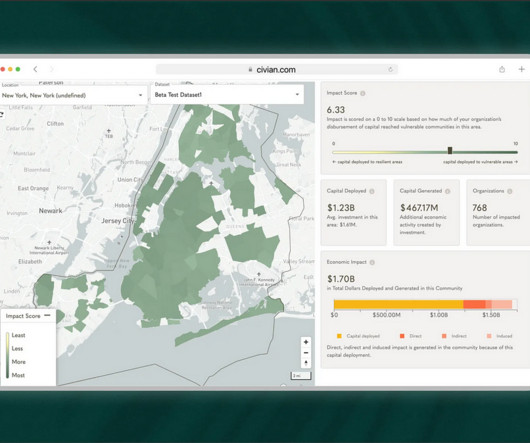
Problem Brief Over a span of 4 weeks, we tested Civians platform and created design solutions to improve the overall user experience of the dashboard. We also encouraged them to think out loud while they were navigating the dashboard, to help us uncover their mental model and identify hidden insights.
Funnel analysis examples can help product managers find the missing puzzle pieces to improve user journeys. From marketing funnel analysis to review funnel analysis, this article shows you the most important funnels for SaaS. Funnel analysis allows you to: Measure company performance. Create data-driven product roadmaps.
How do you conduct user engagement analysis? When your user engagement analysis reveals that users don’t use a feature enough, design interactive in-app flows to help them discover the feature and teach them how to use it. Core feature engagement dashboard in Userpilot. Path analysis. Trend analysis.
Behavior Flow analysis was one of the key reports in General Analytics. TL;DR Behavior flow analysis was a feature in General Analytics that allowed users to visualize paths that the users took when navigating websites. When we mention GA4 Behavior Flow analysis or report, we mean the Path Exploration report. Path exploration.
Let’s face it: qualitative data analysis is vital to understanding why users act in a particular way and how they feel about your product in a way that quantitative product analytics can’t. You will discover: Five qualitative data analysis methods. A six-step analysis process and how to streamline it with Userpilot.
You may have heard a horror story about a business not using impact analysis. This could be avoided with the use of impact analysis. TL;DR Impact analysis evaluates the potential consequences of changes in a project, system, or process to inform decision-making and preparation. Why is it important to conduct an impact analysis?
Step-by-step process to perform behavioral pattern analysis and improve your UX. This principle assumes that users face analysis paralysis when contended with too many options. Funnel analysis : Use tools such as Userpilot to track how users progress through each funnel stage. Funnel analysis report generated with Userpilot.
E.g., Identify navigation issues in your analytics dashboard based on real-time user interactions. To keep the data manageable, you also need to have a system of data organization in place, such as transcriptions, spreadsheets, qualitative analysis tools, etc. Both data types require different analysis methods.
Inactivity skipping : Jump to key moments in each session for efficient analysis. Heap’s strongest feature is its capacity for retroactive analysis. Setting up dashboards is confusing. Main session recording features : Event-linked replays : Directly access session replays tied to specific user events for precise analysis.
Latest Update Features: Custom Toolbars: Full control over dashboard menus. Custom Toolbar Options: Full Control Over Menus Developers can now fully customize dashboard and visualization toolbars using the revealView.onMenuOpening event handler. Date-based filtering allows single-date selection for precise analysis.
Factors I consider when evaluating customer analytics tools Important core features Analytics dashboards : Provide real-time visualizations of key performance indicators (like active users and page views) at a glance, so you can easily track changes. Example of a Userpilot dashboard showing free trial to paid user conversion rate.
Real-World Example If product analytics shows a high abandonment rate during a workflow, you might embed a dashboard or visualization that makes the workflow clearer. By incorporating analytics directly into your product, you provide users with tools that not only address their pain points but also generate richer data for analysis.
We organize all of the trending information in your field so you don't have to. Join 96,000+ users and stay up to date on the latest articles your peers are reading.
You know about us, now we want to get to know you!
Let's personalize your content
Let's get even more personalized
We recognize your account from another site in our network, please click 'Send Email' below to continue with verifying your account and setting a password.


Let's personalize your content