This site uses cookies to improve your experience. To help us insure we adhere to various privacy regulations, please select your country/region of residence. If you do not select a country, we will assume you are from the United States. Select your Cookie Settings or view our Privacy Policy and Terms of Use.
Cookie Settings
Cookies and similar technologies are used on this website for proper function of the website, for tracking performance analytics and for marketing purposes. We and some of our third-party providers may use cookie data for various purposes. Please review the cookie settings below and choose your preference.
Used for the proper function of the website
Used for monitoring website traffic and interactions
Cookie Settings
Cookies and similar technologies are used on this website for proper function of the website, for tracking performance analytics and for marketing purposes. We and some of our third-party providers may use cookie data for various purposes. Please review the cookie settings below and choose your preference.
Strictly Necessary: Used for the proper function of the website
Performance/Analytics: Used for monitoring website traffic and interactions
Reports & analytics : Provide tailored analytics, dashboards, and reporting capabilities to track customer engagement, identify trends , and enable data-driven decision-making for improved customer success. Reporting and dashboards for outcome tracking. Reporting and dashboards for keeping a real-time pulse on customer sentiment.
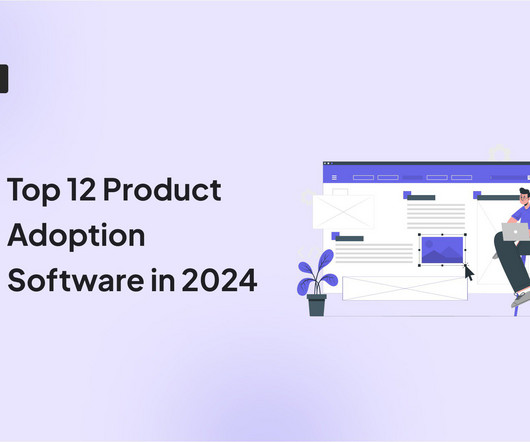
As you’re researching dashboard reporting tools, you’ve probably noticed how hard it is to find reliable information on the available solutions. To make your life a little bit easier and help you choose the best dashboard analytics tool for your SaaS, we’ve produced a guide of 12 excellent platforms available on the market in 2024.
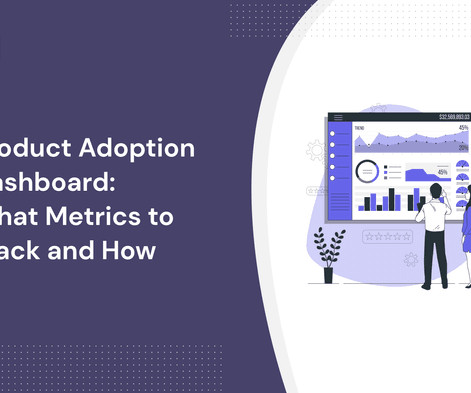
A product adoption dashboard helps you visualize key adoption metrics so you can make data-driven decisions and boost user engagement. In this article, we cover the following: Why you need a product adoption dashboard. Steps to measure adoption using a comprehensive dashboard. Build your dashboard or use a template.
That said, let’s explore the most critical product marketing metrics to track, along with the latest benchmarks in 2024: Check out the 2024 Benchmark Report. Userpilot allows you to create dashboards, add all these metrics, and customize their appearance. User activation rate Benchmarks 2024. User activation rate formula.
Organizations look to embedded analytics to provide greater self-service for users, introduce AI capabilities, offer better insight into data, and provide customizable dashboards that present data in a visually pleasing, easy-to-access format.
Are they in tune with the latest tendencies that will shape 2024 and beyond? We’ll unveil the icon design trends for 2024, tailored specifically for UI/UX designers and startups. We’ll unveil the icon design trends for 2024, tailored specifically for UI/UX designers and startups.
Reveal Embedded Analytics 2024 is just around the corner, and we’re thrilled to share a sneak peek into what Reveal has in store for you! New Toolbar for Enhanced Visualization Control The centerpiece of our 2024 feature lineup is the brand-new toolbar. Stay tuned for these incredible features and more coming your way in 2024.
Here are metrics you can use, along with their averages for Martech companies from Userpilot’s SaaS Product Success Metrics Report 2024 : Average customer activation rate : 24%. These are the metrics we used to analyze the performance of 547 SaaS companies from 7+ industries in our SaaS Product Metrics Benchmark Report 2024.
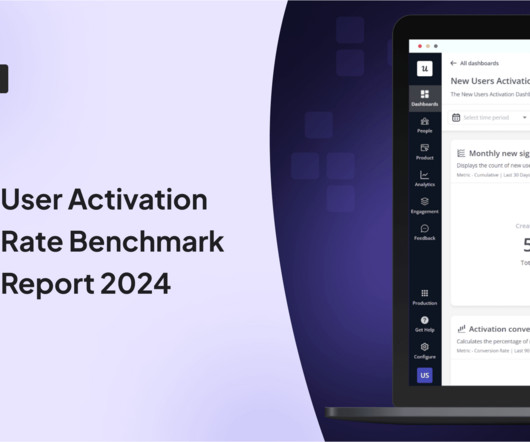
That’s one of the questions about user activation rates that we explore in our Product Metrics Benchmark Report 2024. Userpilot’s SaaS Product Metrics Benchmark Report 2024. This was based on data from 62 B2B companies collected with Userpilot’s New User Activation dashboard. And there are plenty more! Book the demo!
This article will highlight 23 of the best UX research tools available in 2024. 23 best UX research tools of 2024 To help you choose the right tools for improving your user experience, we’ve compiled a list of the 23 best UX research tools of 2024. Viewing dashboards created in Userpilot. UserTesting dashboard.
This article dives into some of the best tools in 2024. No-code SaaS tools are software products that allow users to create applications, in-app experiences , analytics dashboards or automate marketing processes without writing any traditional programming code. Product usage dashboard in Userpilot.
Analytics dashboards : What is data analytics without a dashboard ? Userpilot provides 4 types of dashboards for tracking different product usage metrics – e.g., active users , average session duration , feature adoption rate, user retention, etc. Userpilot product analytics dashboard. Google Analytics dashboard.
Amplitude’s main dashboard. Amplitude’s experiment dashboard. Analytics dashboards : Userpilot’s various dashboards enable you to track product usage metrics such as the number of active users , sessions , average session duration, and feature adoption rate from a single view. Pendo’s dashboard.
To make your life a little bit easier and help you choose the best product analytics tool for your SaaS, we’ve produced a guide of 14 excellent analytics platforms available on the market in 2024. The account view in Totango allows business users to view all the customer insights from individual customers in one singular dashboard.
The best CCM solutions for 2024 include: Userpilot – best in-app customer engagement solution for web apps. Top customer communications management software in 2024 Now that we know what to look for let's examine the top customer communications management software this year, focusing on what makes each one a standout choice.
Create custom reports and dashboards. 12 top customer retention software tools in 2024 With the theory out of the way, here are our 12 customer retention software picks. Recently, Userpilot launched custom dashboards so you can track all relevant metrics from one place without switching between tools and reports.
Analytics dashboard : Track all your adoption-related metrics in one simple dashboard. Userpilot analytics dashboard. Customizable dashboard : Add your preferred analytic widgets to your dashboard so you always have your most important metrics within reach. Whatfix analytics dashboard. Intercom Dashboard.
Analytics dashboards. Userpilot's analytics dashboard lets teams place relevant metrics (such as active users , session duration , feature adoption , etc.) into different dashboards for their convenience. In a future update, Userpilot will offer dashboard customizability that will let teams house metrics of their choosing.
Userpilot dashboard. Pendo dashboard. Trello dashboard. Feature requests – You can use Trello to organize user feedback in a single dashboard. Product teams can use Productboard as a centralized dashboard to collect user feedback and prioritize what to build next in the product development lifecycle.
Starts at $249/month and supports up to 250 survey responses per month, 10 user segments, 15 feature tags, a built-in NPS dashboard , and access to third-party integrations (except HubSpot/Salesforce). The Exploration dashboard within Google Analytics allows you to run a variety of comprehensive, custom-built analyses of your raw data.
The Starter plan only gets trend reports and access to analytics dashboards. Collect and analyze user sentiment data with NPS surveys , NPS dashboard , and response tagging. You also get access to survey analytics dashboards to quickly interpret the results. Product analytics. User engagement. All plans get UI patterns.
To help you make the best choice, we’ve meticulously curated a list of the 12 best options available in 2024. You can create, run, and monitor tests directly from your dashboard just with a few clicks. There are so many multivariate testing tools available that it can be difficult to choose the right one.
With the worldwide revenue from the financial technology sector to double by 2024 , fierce competition evolves. Inefficient dashboard configuration Traders often leverage dashboards to monitor data from personal accounts, control transactions and contracts, follow the latest currency market trends and shifts.
A platform like Userpilot allows you to create custom dashboards and measure only the metrics that relate to your goals. Benchmark: Mixpanels 2024 benchmark report found the average stickiness across industries to be 37%. 2024 research by Adjust found the typical range to be 6.55-28.62 – Aakash Gupta.
This includes regularly monitoring product analytics metrics to measure progress and visualizing data using analytics dashboards to draw valuable insights. Such tools provide you with customizable dashboards and automated product analytics without any of the complexity. Analytics dashboards in Userpilot.
Behavior monitoring : Utilize feature tags and custom events to monitor user actions, with a visual dashboard for tracking segment behavior. Analytic dashboards : Keep important metrics at your fingertips with predesigned dashboards. UXCam Product KPIs dashboards. Analyze behavior with Userpilot. Amplitude journey report.
Whether it’s customizing workflows, dashboards, or reports, the ability to tailor the tool to fit your product development process can significantly enhance your efficiency and effectiveness. Analytics dashboard : The analytics dashboard provides a comprehensive overview of all important metrics in one place.
What are the best Salesforce integrations in 2024? Customize dashboards and reports for specific business needs. TL;DR Salesforce integrations connect the CRM with other platforms to enhance functionality, streamline operations, and improve data sharing. Enhance decision-making with insights into user performance and engagement.
Mixpanel dashboard view. Access a detailed view of user analytics metrics and KPIs in customizable dashboards and reports. Real-time dashboard. Get access to an analytics dashboard to see how your pages perform and the results of your tests. It also enables them to take action and improve retention and user engagement.
To prepare for the workshop, Tali created a fictional case study, and with the help of ChatGPT, she generated six interview snapshots and some analytics dashboards. Product in Practice: Introducing Opportunity Solution Trees at Texthelp was first posted on February 14, 2024 at 6:00 am.
They’re easy to set up from its dashboard. And when you paste a link to Amplitude Dashboard, Chart, or Notebook, a preview appears automatically in the chat. There are a few ways to integrate Amplitude with other platforms: Built-in integrations : There are currently 138 no-code integrations available to Amplitude users.
Activation rate benchmarks for various industries in 2024 range from 54.8% Userpilot allows you to create onboarding flows without coding and enables tracking activation rate and related metrics from a single dashboard. User activation rate benchmarks in 2024. One of the stand-out features is custom analytics dashboards.
We have created an ultimate guide that will serve as a blueprint for SaaS owners to maximize SaaS customer success in 2024. NPS dashboard in Userpilot Userpilot is also a fully no-code solution which means your customer success manager won’t have to double as a coder just to improve engagement and retention with the tool. No worries!
Heres what that looks like in action: Instant access to customer insights: No more switching tabs or diving into dashboards. Gainsights Slack agent knocks down these roadblocks and ensures the right peoplewhether they log into Gainsight every day or notcan access the information and best practices they need to power their workflows.
You will also learn how to leverage analytics dashboards to track them efficiently for better-informed decision-making. Userpilot enables healthcare providers to track patient engagement with their portals from custom dashboards. You can use insights from reports like Userpilot’s SaaS Product Metrics 2024 Benchmark Report.
Additionally, good tools allow you to visualize data through different dashboards, charts, or graphs. Top 10 customer success management software in 2024 To help you narrow down your choices, here are our picks for the top 10 customer success software in 2024. Userpilot’s analytics dashboard. Customer segmentation.
A good product analytics tool should offer varied features for measuring customer behavior, integration options, data visualization dashboards, and automatic data capture. Analytics Dashboards for Data Visualization : Effective tools should have dashboards that present data. Mixpanel product metrics dashboard.
Although Clari is often praised for its clean dashboard and easy tracking functions, it’s also underpowered and buggy. Pros of Clari autocapture Some notable pros of Clari auto-capture include: Clari is renowned for its clean dashboard visualization. Depending on your needs, the dashboard may be too simplistic.
With white-label analytics , your customers get access to dashboard/reporting customized to your current applications experience. With white labeling software, you can fully customize the fonts, colors, button shapes, and more of a vendor’s analytics so your white label dashboard matches your brand perfectly. Low-code/no-code tools.
We started a survey on March 26 and to date (April 4, 2024), it’s been shown to 852 users and 41 users have completed it. With Userpilot’s custom dashboards , you can view up to 30 metrics and reports in one place. Userpilot dashboard. In addition to dashboards, Userpilot allows you to evaluate feature usage with heatmaps.
A/B Testing results for FinTrack dashboard interface By integrating qualitative and quantitative approaches, a comprehensive view of user experience can be achieved, enabling more informed decisions and targeted improvements. With the UEIS, youre not just measuringyoure transforming UX.
Using large language models (LLMs) and purpose-built AI, Pulse analyzes responses in real-time and presents results in streamlined dashboards with granular insights that allow businesses to respond to customer feedback faster.
Userpilot supports custom dashboards so you can track all your key metrics in one place. In the meantime, check out our SaaS Product Metrics 2024 report. To do this, use an analytics tool or a product growth platform like Userpilot. Book your place on How to Optimize Your Product Metrics for Growth by Dan Olsen.
We organize all of the trending information in your field so you don't have to. Join 96,000+ users and stay up to date on the latest articles your peers are reading.
You know about us, now we want to get to know you!
Let's personalize your content
Let's get even more personalized
We recognize your account from another site in our network, please click 'Send Email' below to continue with verifying your account and setting a password.


Let's personalize your content