This site uses cookies to improve your experience. To help us insure we adhere to various privacy regulations, please select your country/region of residence. If you do not select a country, we will assume you are from the United States. Select your Cookie Settings or view our Privacy Policy and Terms of Use.
Cookie Settings
Cookies and similar technologies are used on this website for proper function of the website, for tracking performance analytics and for marketing purposes. We and some of our third-party providers may use cookie data for various purposes. Please review the cookie settings below and choose your preference.
Used for the proper function of the website
Used for monitoring website traffic and interactions
Cookie Settings
Cookies and similar technologies are used on this website for proper function of the website, for tracking performance analytics and for marketing purposes. We and some of our third-party providers may use cookie data for various purposes. Please review the cookie settings below and choose your preference.
Strictly Necessary: Used for the proper function of the website
Performance/Analytics: Used for monitoring website traffic and interactions
The following data and information on Business Services apps is from our 2022 Mobile App Customer Engagement Report. Brands in Business Services had varied experiences in 2021. Below is a short summary of how Business Services apps fared in 2021. Data included: Ratings and reviews.
The following data and information on Shopping apps is from our 2022 Mobile App Customer Engagement Report. Subcategories for Personal Services Apps: Home and Family. Rather than comparing by benchmark, below is a short summary of both the Home and Family apps included in our data. Interaction and response rates.
This report contains data from the following app categories: Finance. Personal Services. Business Services. There are three feedback-focused product goals winning mobile teams should prioritize in 2022: Focus on the first 30 days. Food and Drink. Healthcare. Media and Entertainment. Segment by customer emotion.
New research from Harvard Business Review AnalyticServices reveals that businesses of all sizes – from small businesses to enterprises – are realizing the business value of personal, efficient customer engagement. Below, we take a deeper dive into the report’s key data and trends. But they’re facing big barriers.
Speaker: John Mansour - President, Product Management University
Product analytics are all the rage, but how can you use them to your advantage? With uncertainty surrounding our economical future — and whispers of an impending recession — what insights can we get from our product analytics that’ll put us in the express lane to growth? Analytics that guarantee customer value.
I’m going to take a wild guess and assume that you already understand the importance of mobile in-app feedback tools. You also might be reading this post thinking: “Who’s adding new tools to their tech stack right now?” Do you have the right tools to capture that voice? Mobile in-app feedback tools & solutions.
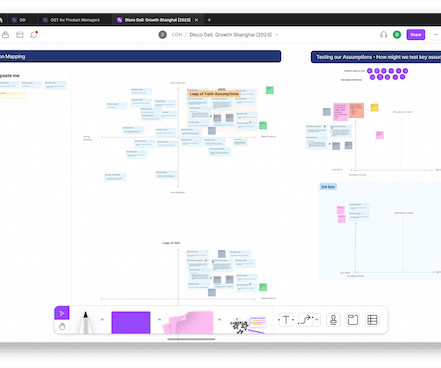
The opportunity solution tree helps visualize all the work that goes into continuous discovery. And while opportunity solution trees have become increasingly common among product teams, there’s still plenty of room for customization, both in the way you set up your trees and the tools you use to build them.
Drawing from his 20+ years of technology experience and extensive research, Nishant shared insights about how these activities vary across different organizational contexts – from startups to enterprises, B2B to B2C, and Agile to Waterfall environments.
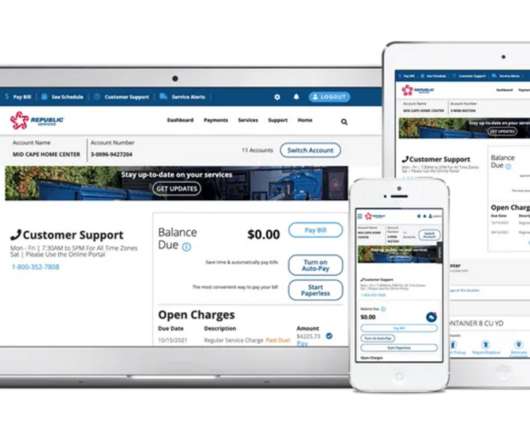
The following data and information on Utilities apps is from our 2022 Mobile App Customer Engagement Report. Data included: Ratings and reviews. DOWNLOAD THE FULL 2022 BENCHMARK REPORT HERE. Additional visual benchmark data for Utilities apps. ?DOWNLOAD Interaction and response rates.
Speaker: Hannah Chaplin - Product Marketing Principal & Steve Cheshire - Product Manager
Without product usage data and user feedback guiding your product roadmap, product managers and engineers end up wasting money, time, and effort building what they think stakeholders want, rather than what they know they need. This lack of insight makes it impossible for these teams to prioritize.
The following data and information on Media apps is from our 2022 Mobile App Customer Engagement Report. Rather than a benchmark comparison, below is a short summary of the six subcategories included in our data: News, Telco, Technology, Games, Sports, and Music. Data included: Ratings and reviews. Popular phrases.
Watch the recording of Christy Culp, Apptentive’s Chief Customer Officer and Director of Marketing, Ashley Sefferman, as they discuss 2022 mobile app trends and category-specific benchmarks to help quantify your app’s success. They share insights applicable across the mobile landscape, as well as benchmarks specific to your industry.
The following data and information is from our 2022 Mobile App Customer Engagement Report. Consumers in each subcategory have vastly different motivations and usage patterns, which we see represented in the data. Data included: Ratings and reviews. DOWNLOAD THE FULL 2022 BENCHMARK REPORT HERE.
The following data on mobile surveys and interaction and response rates is from our 2022 Mobile App Customer Engagement Report. While correlation isn’t causation, looking at overlapping data points can help us infer what bets paid off for mobile product teams, along with where they can adjust their roadmaps to improve.
So, what does ABM look like in 2022? ZoomInfo has created the following eBook to help other B2B organizations gain insights on how to launch their own data-driven ABM strategy. Analysts and professionals alike tend to argue that account based marketing (ABM) is not new. On the surface, this is an accurate statement.
The following data and information is from our 2022 Mobile App Customer Engagement Report. Apptentive’s Love Dialog feature is used to gather the data, which starts with a simple “yes” or “no” question: “Do you love our company?” Understanding consumer sentiment starts with gauging consumer emotion.
The following data originates from our 2022 Mobile Consumer Engagement Report, which can be read in full here. Apptentive’s data shows an average 30-day retention rate of 67%—an increase of more than three times the industry average, driven by proactive consumer engagement.
In our 2022 Mobile Customer Engagement Benchmark Report , a study of more than 1,000 apps across a billion mobile app installs, we take a close look at apps in the Healthcare category. Healthcare apps are divided into three subcategories: Medical (public health, condition management, reproductive services, etc.)
The following data and information on Travel apps is from our 2022 Mobile App Customer Engagement Report. But what about all those times when one of our famous customer service Red Coats isn’t right around the corner? Data included: Ratings and reviews. DOWNLOAD THE FULL 2022 BENCHMARK REPORT HERE.
Get the tools to turn data into actionable insights and deliver personalized, relevant, timely messaging to increase conversions and maximize your ROI. In 2022, our offline and online worlds are more integrated than ever before. Multichannel and omnichannel marketing are not the same. Today’s consumers have evolved.
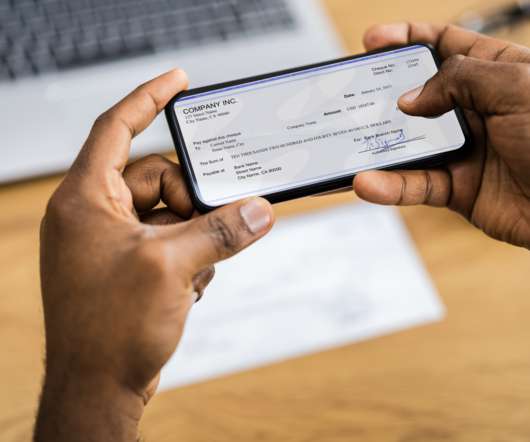
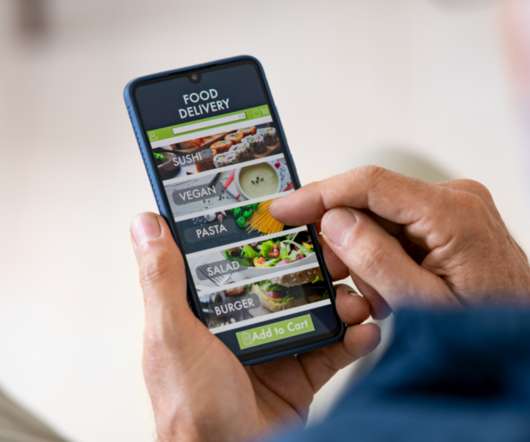
Subcategories: Restaurant, Food Services. In our 2022 Mobile Customer Engagement Benchmark Report , a study of more than 1,000 apps across a billion mobile app installs, we take a close look at apps in the Food and Drink category. Data included: Ratings and reviews. Download the full 2022 Benchmark Report here.
The following data and information on Shopping apps is from our 2022 Mobile App Customer Engagement Report. Data included: Ratings and reviews. DOWNLOAD THE FULL 2022 BENCHMARK REPORT HERE. Additional visual benchmark data for Shopping apps. ?DOWNLOAD Interaction and response rates.
In 2022, 1,998 of you told us about your product trio habits. In both years, people who reported working in a product trio were more satisfied with both their team and their company. These findings were consistent with our 2022 survey. This is also what we saw in 2022 (62.7%). The data confirms this.
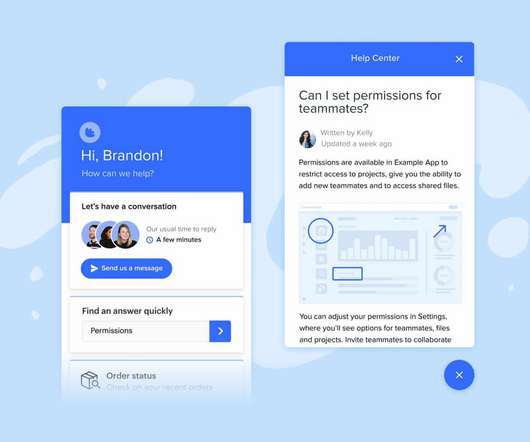
A recent Forrester Consulting study commissioned by Intercom, Drive Conversational Experiences For A Future-Ready Customer Support Strategy , revealed that 54% of teams can’t personalize support with their tech stack and 50% waste time jumping between tools. So before you begin searching for specific tools, define your goals upfront.
According to survey data from the 2022 Product Benchmark report, product-led companies are more than twice as likely to grow quickly (100%+ year-over-year revenue growth) than sales-led companies, especially those offering a freemium product.
Enhanced customer service. Capture: Make sure you have a tool like Apptentive in place to capture all of this customer feedback data in the first place. You won’t be able to make accurate decisions about your product without actual data to support it. The post What is Customer Engagement, and Why is it Important in 2022?
The following data comes from our seventh-annual Mobile Customer Engagement Report and provides a holistic view of where most apps stack up when it comes to ratings and reviews. Download the full report for yourself to see industry-specific data along with more macro trends around loyalty, retention, surveys, response rates, and more.
The Price of Decision-Making Challenges In a 2022 survey conducted by Airfocus , 56.4% Even more startling, product managers reported spending 45% less time on strategy than theyd like in 2023. Use this insight to refine your approach. As leaders, we cant ignore these realities but we can change how we respond.
When Duolingo redesigned its app in 2022, engagement spiked overnight. However, without qualitative feedback and behavioral insights, teams risk misreading signals, leading to frustration and churn. User feedback is valuable , but without data, its just opinions. Key differences between data types. The problem?
Speaker: Nicole Munson, Senior Product Manager at American Express
Product Manager at Amex Savings, for this insightful webinar based on her many years of launching products to a variety of end-users. Best ways to use data to design new experiences. Best ways to use data to design new experiences. Tips and tricks to understand data efficiently.
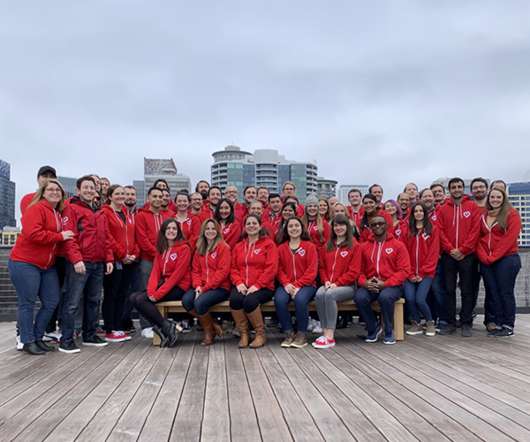
From celebrating our ten-year anniversary to being recognized as one of the 100 Best Companies to Work For by Seattle Business Magazine to the publication of our sixth annual Mobile Customer Engagement Benchmark Report and much more detailed below, 2021 was a tremendously successful and exciting year for Apptentive.
While this shift was already underway, the rate of digital transformation is now happening much faster than previously predicted due to the impact of the COVID-19 pandemic. According to the International Data Corporation (IDC) , 65% of global GDP will be digitalized by 2022, and investment in digital transformation (DX) continues to grow.
Let’s get some help and learn how to talk about the importance of innovation with senior leaders and the tools that can help organizations be better at innovation. Bruce’s research, highlighted in the groundbreaking book Serial Innovators revealed fascinating insights into these exceptional team members.
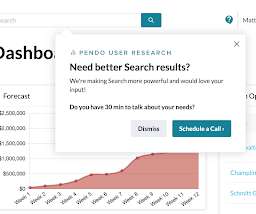
Last month we turned our attention to data – unleashing new features that help you improve how you collect, access, and use first-party data to influence your product and scale your business. Surveys: Now even more insightful and engaging. Gain deeper insights with advanced reporting for Surveys.
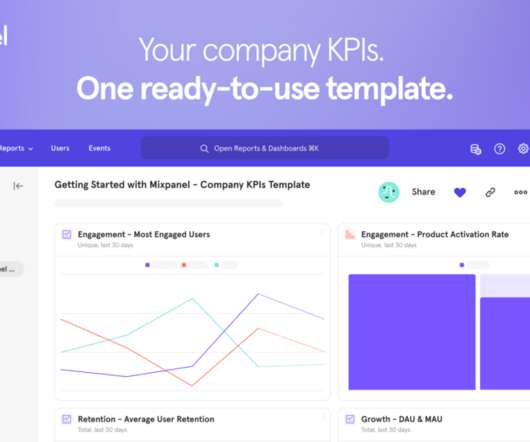
Learn about the importance of mobile app KPI dashboards and copy dashboards from real mobile app product managers, engineers and designers. A key performance indicator (KPI) dashboard is a visual representation of data that quantifies how well a team is performing towards its goals.
However, even when product trios commit to weekly interviews with customers, their companies may have other avenues for collecting customer feedback and insights. And the company might even have analyticstools or surveys in place to monitor customer behavior and collect feedback directly from customers. When will they need it?
Similarly, the opportunity solution tree can be an incredibly powerful tool for keeping track of your desired outcome , the opportunities you learn about during discovery, the solutions you’re considering for each opportunity, and the experiments you’ll run to assess your ideas. It’s about finding the tech stack that works for your team.
Let’s find out the evolution of e-commerce technology in terms of trends and statistics in 2022. Most importantly, big data and machine learning have paved the way for robotics automation and various software applications. Besides, these e-commerce technologies have promoted the instant transfer of data and mobile devices.
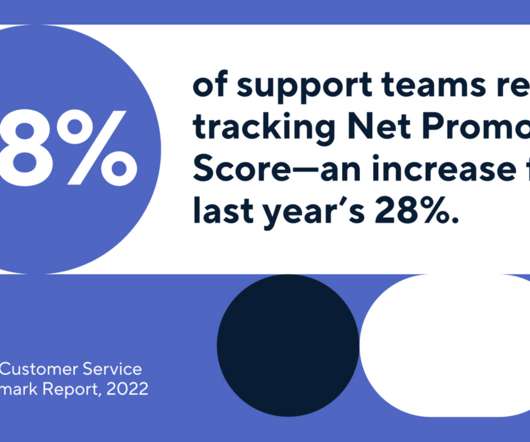
But there’s a silver lining – this year’s Klaus Customer Service Quality Benchmark Report reveals there are clear positive shifts taking place in the customer support landscape in 2022. Klaus partnered with Intercom, Aircall , and Support Driven to create the second edition of the highly anticipated benchmark report.
Are you wondering how to effectively use SaaS analytics to reduce churn? You can collect heaps of data but they won’t be of any use if you don’t know what to do with them. SaaS analytics allow you to leverage the data to gain actionable insights and make informed decisions. What is SaaS analytics?
For today’s Tools of the Trade , we caught up with Yury Oleynik , the VP of Product Management at HiveMQ , who has managed to make continuous interviewing a reality on his team. Yury shares a few of the tactics his team tried to automate recruiting before they came across the tool they’re currently using, Orbital.
Product analytics can help by showing companies what is and isn’t working with their websites and apps, what to prioritize, and what to invest in. Startups in the program receive: $50,000 in credits toward the Mixpanel Growth Plan Credits worth 430 million monthly events Unlimited access to Cohorts, data modeling, and email support.
With the 2022 Customer Service Quality Benchmark Report , we wanted to look deeper than individual metrics. The results are in: businesses are investing more in measuring the impact of their customer service and turning to tools such as self-service and proactive support to drive a good experience.
But if you have a breather, we’re excited to share some data-backed mobile engagement findings, specifically surrounding how seasonality impacts customer sentiment! While we can hypothesize that the lack of Vitamin D certainly contributes to grumpier customers in the gloomier months, we needed data to support our claims.
We organize all of the trending information in your field so you don't have to. Join 96,000+ users and stay up to date on the latest articles your peers are reading.
You know about us, now we want to get to know you!
Let's personalize your content
Let's get even more personalized
We recognize your account from another site in our network, please click 'Send Email' below to continue with verifying your account and setting a password.


Let's personalize your content