This site uses cookies to improve your experience. To help us insure we adhere to various privacy regulations, please select your country/region of residence. If you do not select a country, we will assume you are from the United States. Select your Cookie Settings or view our Privacy Policy and Terms of Use.
Cookie Settings
Cookies and similar technologies are used on this website for proper function of the website, for tracking performance analytics and for marketing purposes. We and some of our third-party providers may use cookie data for various purposes. Please review the cookie settings below and choose your preference.
Used for the proper function of the website
Used for monitoring website traffic and interactions
Cookie Settings
Cookies and similar technologies are used on this website for proper function of the website, for tracking performance analytics and for marketing purposes. We and some of our third-party providers may use cookie data for various purposes. Please review the cookie settings below and choose your preference.
Strictly Necessary: Used for the proper function of the website
Performance/Analytics: Used for monitoring website traffic and interactions
Today, we’re thrilled to release our 2021 Mobile App Engagement Benchmark Report. Apptentive’s annual mobile app engagement benchmark report serves as a baseline to help you understand your app’s engagement strengths and areas for improvement. What’s New in the 2021Report. See the Report.
The opportunity solution tree helps visualize all the work that goes into continuous discovery. And while opportunity solution trees have become increasingly common among product teams, there’s still plenty of room for customization, both in the way you set up your trees and the tools you use to build them.
Do you have the right tools to capture that voice? To help you with this, we compiled a list of the top mobile in-app feedback tools of 2021. Incorporating these tools into your customer experience tech stack will drive more engagement, gather high-quality customer feedback, and help inform your product roadmap.
The following data and information on Business Services apps is from our 2022 Mobile App Customer Engagement Report. Brands in Business Services had varied experiences in 2021. Below is a short summary of how Business Services apps fared in 2021. Data included: Ratings and reviews.
Speaker: speakers from Verizon, Snowflake, Affinity Federal Credit Union, EverQuote, and AtScale
Join this webinar panel for practical advice on how to build and foster a data literate, self-service analysis culture at scale using a semantic layer. In this webinar you will learn about: Making data accessible to everyone in your organization with their favorite tools.
The following data and information on Shopping apps is from our 2022 Mobile App Customer Engagement Report. Subcategories for Personal Services Apps: Home and Family. Rather than comparing by benchmark, below is a short summary of both the Home and Family apps included in our data. Data included: Ratings and reviews.
If 2020 was the shift to mobile, 2021 was the year we saw it reflected in the numbers. This report contains data from the following app categories: Finance. Personal Services. Business Services. The post Introducing: 2022 Mobile Customer Engagement Benchmark Report appeared first on Apptentive. Healthcare.
I’m going to take a wild guess and assume that you already understand the importance of mobile in-app feedback tools. You also might be reading this post thinking: “Who’s adding new tools to their tech stack right now?” Do you have the right tools to capture that voice? Mobile in-app feedback tools & solutions.
Brands in the Business Services category faced diverse 2020 challenges. In our 2021 Mobile App Engagement Benchmark Report , a study of 1,000 apps across a billion+ app installs, we take a close look at apps in the Business Services category. Below is a summary of our research specifically on Business Services apps.
Speaker: Megan Brown, Director, Data Literacy at Starbucks; Mariska Veenhof-Bulten, Business Intelligence Lead at bol.com; and Jennifer Wheeler, Director, IT Data and Analytics at Cardinal Health
Join data & analytics leaders from Starbucks, Cardinal Health, and bol.com for a webinar panel discussion on scaling data literacy skills across your organization with a clear strategy, a pragmatic roadmap, and executive buy-in. In this webinar, you will learn about: Launching data literacy programs and building business cases.
Subcategories: Restaurant, Food Services. In our 2022 Mobile Customer Engagement Benchmark Report , a study of more than 1,000 apps across a billion mobile app installs, we take a close look at apps in the Food and Drink category. Data included: Ratings and reviews. Download the full 2022 Benchmark Report here.
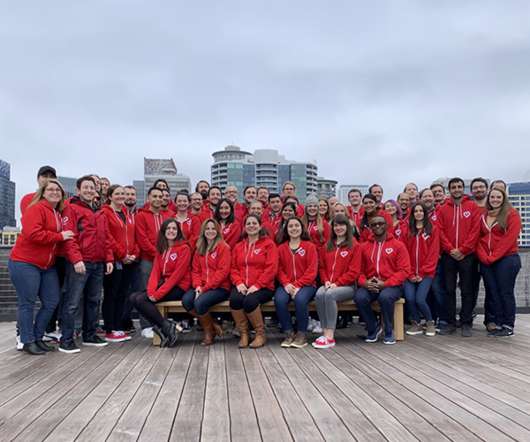
From celebrating our ten-year anniversary to being recognized as one of the 100 Best Companies to Work For by Seattle Business Magazine to the publication of our sixth annual Mobile Customer Engagement Benchmark Report and much more detailed below, 2021 was a tremendously successful and exciting year for Apptentive.
In our 2021 Mobile App Engagement Benchmark Report , a study of 1,000 apps across a billion+ app installs, we take a close look at apps in the Education category. Read on for data-supported research and benchmarks Education apps should focus on in 2021 and beyond based on what was learned from a year like no other.
How product managers can use visual storytelling to make their ideas stand out. As we move into 2021, the name of this podcast is changing to better reflect our objective here—product managers become product masters. Using visuals to help communicate information can be very helpful. That new name is Product Masters Now.
These days, a simple A/B test can seem to incorporate the whole alphabet, and making a decision from that data isn't as easy as A, B, C either. How can we shorten the time it takes to do the tests while gaining larger amounts of data? Are we even gaining any new insight into the data we are receiving?
To help your finance app stand out in 2021, focus on these four strategies at the start of the new year. Money is highly personal, and given the intensity of emotions associated with money, it strikes us as odd that more financial institutions have yet to tap into this gold mine of customer emotion data and CX insight.
No tool will give you answers, only offer leads you can follow to find the real answers. Until recently, our observability tooling has been primarily based on metrics. A typical workflow involved looking at a dashboard full of charts with metrics sliced and diced by various attribute combinations. Answers*: Note the asterisk.
In our 2021 Mobile App Engagement Benchmark Report , a study of 1,000 apps across a billion+ app installs, we take a close look at apps in the Utilities category. Read on for data-supported benchmarks Utilities apps should focus on in 2021 and beyond based on what was learned from a year like no other.
Defining Continuous Discovery: Setting a Clear Benchmark In my book that came out in May of 2021, I decided to define continuous discovery. This definition is a mouthful, so I like to visualize it. I’m going to walk through this visual quickly, and then Cecilie and I are going to dive into this in more depth.
Speaker: Ahmad Jubran, Cloud Product Innovation Consultant
Optimize serverless and managed data processing pipelines. Interpret and make decisions from a cloud dataanalytics infrastructure. Take your product a step further in the cloud with ML and AI services. Tuesday January 12, 2021 at 12:30PM PST, 3:30PM EST, 8:30PM GMT And much more!
In our 2021 Mobile App Engagement Benchmark Report , a study of 1,000 apps across a billion+ app installs, we take a close look at apps in the Media and Entertainment category. In our data, Media apps are segmented into six subcategories: News (global news networks, newspapers, etc.). 2021 Engagement Benchmarks for Media Apps.
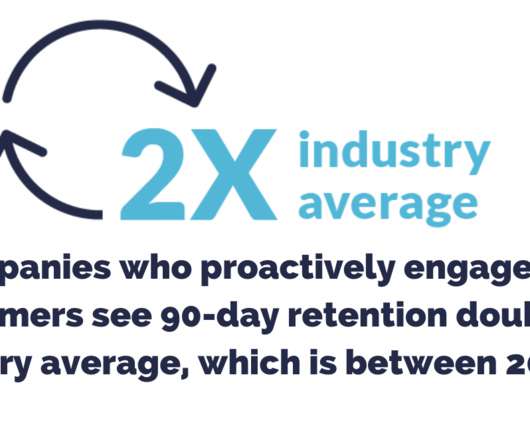
As you act on your 2021 app retention strategy, here are the app retention benchmarks to aim for. App Retention in 2021. Retention is a primary focus in Apptentive’s 2021 Mobile App Engagement Report , a study of 1,000 apps across a billion+ app installs. However, 90-day retention isn’t great for the average mobile app.
One size did not fit all for Personal Services apps in 2020. In our 2021 Mobile App Engagement Benchmark Report , a study of 1,000 apps across a billion+ app installs, we take a close look at apps in the Personal Services category. 2021 Engagement Benchmarks for Personal Services Apps. Consumer Engagement.
Last month we turned our attention to data – unleashing new features that help you improve how you collect, access, and use first-party data to influence your product and scale your business. Surveys: Now even more insightful and engaging. Gain deeper insights with advanced reporting for Surveys.
As a product or technology leader, you likely know there’s a tremendous value that can be gained from predictiveanalytics. Having insights about people, such as understanding purchase intent or pinpointing future inventory needs, gives products the ability to leverage that data and provide significant added value.
The following data and information on Utilities apps is from our 2022 Mobile App Customer Engagement Report. Brands in the Utilities industry faced various hurdles throughout 2021. Below is a short summary of how Utilities apps fared in 2021. Data included: Ratings and reviews. Summary of Utilities apps in 2021.
First-party data is the future of online engagement and customer experiences. In June 2021, Google confirmed that it will no longer track individuals online via cookies. One aspect that can’t be debated is the value of first-party data as we proceed into this cookieless future. What is first-party data?
How product managers can use data to understand customers and create value. Today we are talking about making better product decisions that create customer value using the data you already have. A PR person contacted me about a company that received the 2021 Products That Count award in the Operate category.
The following data on mobile surveys and interaction and response rates is from our 2022 Mobile App Customer Engagement Report. While correlation isn’t causation, looking at overlapping data points can help us infer what bets paid off for mobile product teams, along with where they can adjust their roadmaps to improve.
Speaker: Speakers from SafeGraph, Facteus, AWS Data Exchange, SimilarWeb, and AtScale
Data and analytics leaders across industries can benefit from leveraging multiple types of diverse external data for making smarter business decisions. Data and analytics specialists from AWS Data Exchange and AtScale will walk through exactly how to blend and operationalize these diverse data external and internal sources.
The following data and information on Media apps is from our 2022 Mobile App Customer Engagement Report. Rather than a benchmark comparison, below is a short summary of the six subcategories included in our data: News, Telco, Technology, Games, Sports, and Music. Data included: Ratings and reviews. Popular phrases.
Which product analyticstools should you be using? How many analyticstools do you need? And what type of analytics really matters for a product marketing manager? By the end, you'll know the only type of analyticstools you really need as a PMM. What is product analytics?
In 2021, brands talked to more of their consumers than ever before, while clearly shifting their strategies toward retention. The following data originates from our 2022 Mobile Consumer Engagement Report, which can be read in full here. But in 2021, the risk of churn to both Fans and Risks was comparable throughout the year.
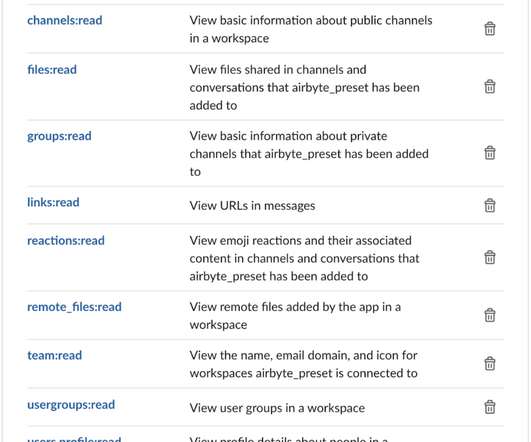
an open-source data integration platform?—?and an open-source data exploration platform?—?in We will use the Airbyte’s Slack connector to get the data off a Slack workspace (we will be using Airbyte’s own Slack workspace for this tutorial). We will save the data onto a PostgreSQL database. and Apache Superset ?—?an
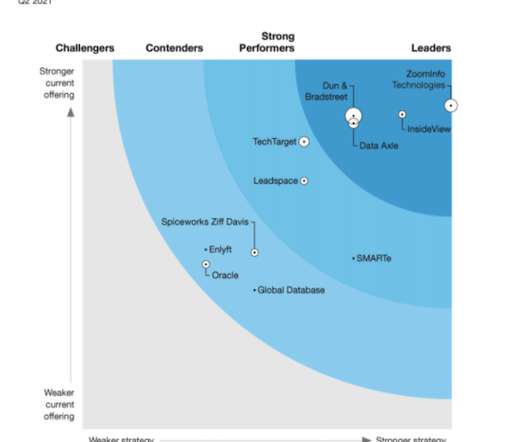
In our 24-criterion evaluation of B2B marketing data providers, we identified the 11 most significant vendors — Data Axle, Dun & Bradstreet, Enlyft, Global Database, InsideView, Leadspace, Oracle, SMARTe, Spiceworks Ziff Davis, TechTarget, and ZoomInfo Technologies — and researched, analyzed, and scored them.
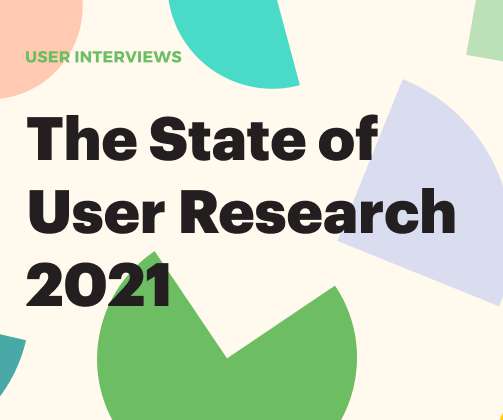
The third annual State of User Research report uncovers trends in UXR methods, tools, salaries, and remote work. Includes data from 525 user researchers in 44 countries.
It’s really hard to make predictions about what will happen in 2021, but we may surely say what technologies will remain at the peak of fame and will be used everywhere in front end development app. In 2021, React will not lose its leading position, and we will continue to create convenient and efficient apps using it.
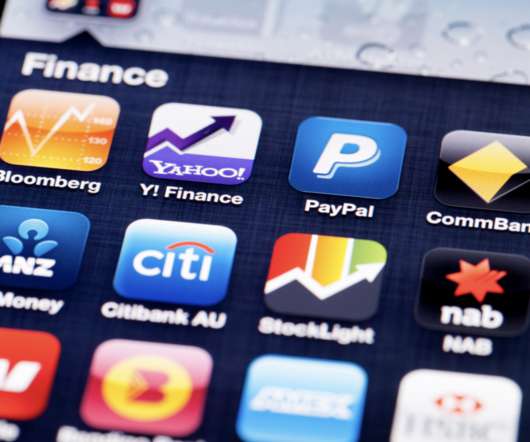
The following data and information is from our 2022 Mobile App Customer Engagement Report. Below is a summary of how Finance app fared over the course of 2021. Below is a summary of how Finance app fared over the course of 2021. Data included: Ratings and reviews. DOWNLOAD THE FULL 2022 BENCHMARK REPORT HERE.
In a commissioned study by Forrester Consulting on behalf of Intercom undertaken in April 2021, Drive Conversational Experiences for a Future-Ready Customer Support Strategy , we learned that only 37% of support leaders and decision-makers are satisfied with their organization’s current digital channels and solutions.
Speaker: Dr. Joe Perez, Senior Systems Analyst at NC Dept. of Health & Human Services, and Chief Technology Officer at SolonTek
Do you have the vision to combine beauty with brains, thereby driving decisions with data? What value do you see in your data? Joe Perez will go over the five "Stages of the Spectrum" in action while discovering the difference between impact and influence, and how that difference plays into making data actionable.
The following data and information on Travel apps is from our 2022 Mobile App Customer Engagement Report. In 2021, Travel began its road to recovery following interstate, national, and global travel restrictions brought on by the pandemic. Data included: Ratings and reviews. DOWNLOAD THE FULL 2022 BENCHMARK REPORT HERE.
Our Holiday Shopping Experience Report, based on a survey of 1,000 U.S. consumers and 500 customer service workers, found that customer expectations are higher than ever – and these increased pressures have led more than half of stressed-out and under-resourced customer support reps to consider leaving their job.
But if you have a breather, we’re excited to share some data-backed mobile engagement findings, specifically surrounding how seasonality impacts customer sentiment! While we can hypothesize that the lack of Vitamin D certainly contributes to grumpier customers in the gloomier months, we needed data to support our claims.
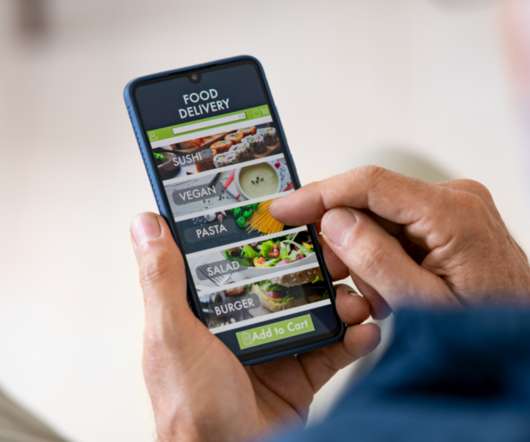
In our 2021 Mobile App Engagement Benchmark Report , a study of 1,000 apps across a billion+ app installs, we take a close look at apps in the Food and Drink category. Read on for data-supported research and benchmarks Food and Drink apps should focus on in 2021 and beyond based on what was learned from a year like no other.
Speaker: Phil Irvine, VP & Director of Audience Intelligence
To accomplish this, organizations have traditionally leaned into historical customer and product data to predict how to engage with their current and future customers in a personalized manner. When you couple that with fluid data privacy changes, this creates an even fuzzier foundation to develop forward-looking marketing strategies.
We organize all of the trending information in your field so you don't have to. Join 96,000+ users and stay up to date on the latest articles your peers are reading.
You know about us, now we want to get to know you!
Let's personalize your content
Let's get even more personalized
We recognize your account from another site in our network, please click 'Send Email' below to continue with verifying your account and setting a password.


Let's personalize your content