This site uses cookies to improve your experience. To help us insure we adhere to various privacy regulations, please select your country/region of residence. If you do not select a country, we will assume you are from the United States. Select your Cookie Settings or view our Privacy Policy and Terms of Use.
Cookie Settings
Cookies and similar technologies are used on this website for proper function of the website, for tracking performance analytics and for marketing purposes. We and some of our third-party providers may use cookie data for various purposes. Please review the cookie settings below and choose your preference.
Used for the proper function of the website
Used for monitoring website traffic and interactions
Cookie Settings
Cookies and similar technologies are used on this website for proper function of the website, for tracking performance analytics and for marketing purposes. We and some of our third-party providers may use cookie data for various purposes. Please review the cookie settings below and choose your preference.
Strictly Necessary: Used for the proper function of the website
Performance/Analytics: Used for monitoring website traffic and interactions
Drawing from his 20+ years of technology experience and extensive research, Nishant shared insights about how these activities vary across different organizational contexts – from startups to enterprises, B2B to B2C, and Agile to Waterfall environments.
The following data and information on Business Services apps is from our 2022 Mobile App Customer Engagement Report. Brands in Business Services had varied experiences in 2021. Below is a short summary of how Business Services apps fared in 2021. Data included: Ratings and reviews. Popular phrases.
If 2020 was the shift to mobile, 2021 was the year we saw it reflected in the numbers. This report contains data from the following app categories: Finance. Personal Services. Business Services. The post Introducing: 2022 Mobile Customer Engagement Benchmark Report appeared first on Apptentive. Healthcare.
The following data and information on Shopping apps is from our 2022 Mobile App Customer Engagement Report. Subcategories for Personal Services Apps: Home and Family. Rather than comparing by benchmark, below is a short summary of both the Home and Family apps included in our data. Data included: Ratings and reviews.
Speaker: Mark Ridley, Owner and Founder, Ridley Industries
In most cases, actually building software should be the last avenue that companies explore to deliver great products, as software engineering, data science and product development are complex, uncertain and hard to manage. January 21, 2020 9AM PST, 12PM EST, 5PM GMT. Engaging with technical talent.
Brands in the Business Services category faced diverse 2020 challenges. In our 2021 Mobile App Engagement Benchmark Report , a study of 1,000 apps across a billion+ app installs, we take a close look at apps in the Business Services category. Below is a summary of our research specifically on Business Services apps.
2020 reset the mobile app engagement playing field. Today, we’re thrilled to release our 2021 Mobile App Engagement Benchmark Report. Apptentive’s annual mobile app engagement benchmark report serves as a baseline to help you understand your app’s engagement strengths and areas for improvement. What’s New in the 2021 Report.
It has also changed how we interact with our favorite stores, restaurants, and service providers – even our healthcare providers. You’d be hard-pressed to find someone who hasn’t had a virtual doctor appointment, ordered groceries online, or used curbside pickup in 2020. Data and Security. Personalization.
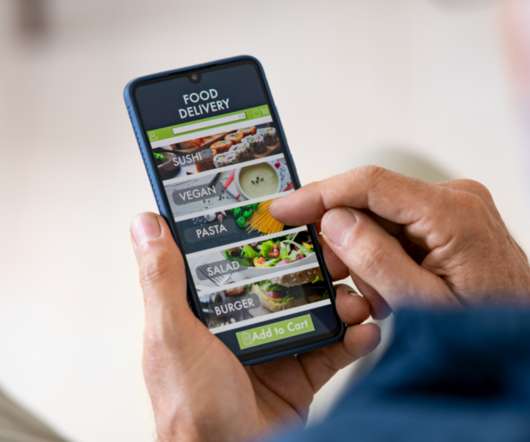
Subcategories: Restaurant, Food Services. In our 2022 Mobile Customer Engagement Benchmark Report , a study of more than 1,000 apps across a billion mobile app installs, we take a close look at apps in the Food and Drink category. Data included: Ratings and reviews. Download the full 2022 Benchmark Report here.
Efficient usage data collection and analytics can open up significant possibilities for suppliers. Yet many software suppliers still struggle to get accurate insights into usage. Yet many software suppliers still struggle to get accurate insights into usage. Top findings include: Growing Interest in Usage Data.
You also might be reading this post thinking: “Who’s adding new tools to their tech stack right now?” Do you have the right tools to capture that voice? In order to help, we’ve taken the liberty of compiling a list of the best mobile in-app feedback tools for you. Core mobile in-app feedback tools & solutions.
Do you have the right tools to capture that voice? To help you with this, we compiled a list of the top mobile in-app feedback tools of 2021. Incorporating these tools into your customer experience tech stack will drive more engagement, gather high-quality customer feedback, and help inform your product roadmap. Apptentive.
When you have solid benchmarks to measure against, they can help you make sense of your own data and answer these questions. ?Download Download the 2020 Mobile App Engagement Benchmark Report for Media Apps. Data from our 2016 , 2017 , 2018 , and 2019 reports is included to show shifts in brand focus and engagement over time.
If 2020 has taught us anything, it’s that predicting the future is hard and in this episode, sponsored by Amplitude, we turn to Margaret Heffernan to learn how to do it better. The post Making Better Predictions – Margaret Heffernan on The Product Experience appeared first on Mind the Product. Using data sensibly.
This report aims to highlight the current state of B2B database and contact acquisition strategies and organizations’ goals to leverage data to fuel their go-to-market strategies in 2020 and beyond. New tactics to acquire data to reach marketing goals. Database benchmarks for education and resource prioritization.
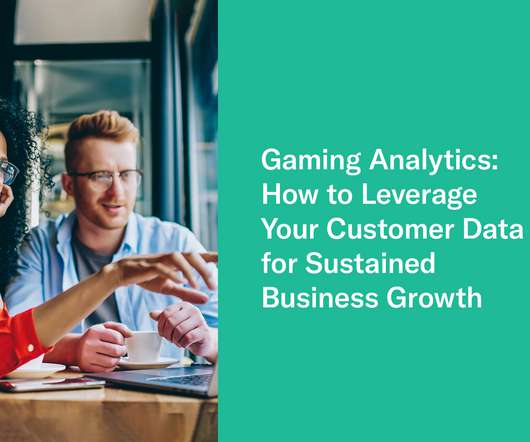
Gaming data is one of the most valuable sources of information out there. . gamers’ weekly leisure time going to playing games as of 2018 — companies are sitting on treasure troves of insight. You need an analytics solution and data strategy that can help make that information useful. . What Is Gaming Analytics?
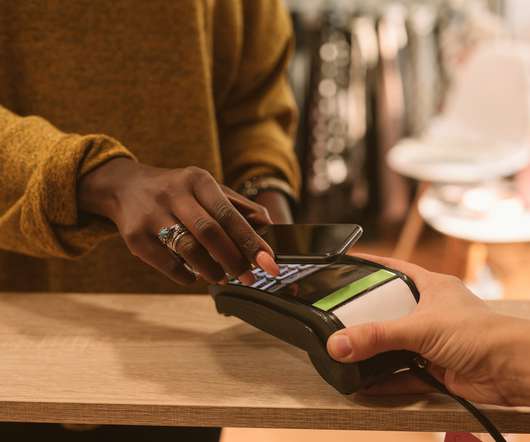
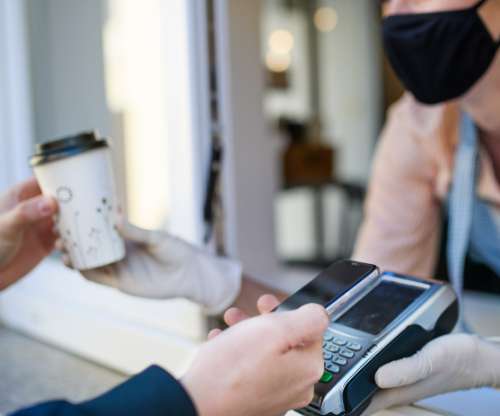
The COVID-19 pandemic has more and more people using app-based food delivery services, and QSRs are seeing an influx of mobile payments at their drive-throughs with the closure of dine-in establishments. When you have solid benchmarks to measure against, they can help you make sense of your own data and answer these questions.
Amplify 2020 gathered product leaders from the likes of IBM and Peloton to discuss the shift to a digital everything world, and the takeaway was clear: Your product is your business. In order to meet this moment, teams need to build fast, and build with data. Product teams can’t afford to make this tradeoff, nor do they have to.
No product tool or template can save you if you’re not killing it in these three areas. That’s why we’ve listed 12 tools that the best product managers use to do their jobs better? That’s why we’ve listed 12 tools that the best product managers use to do their jobs better?—?and and not the best product management tools.
Which sophisticated analytics capabilities can give your application a competitive edge? In its 2020 Embedded BI Market Study, Dresner Advisory Services continues to identify the importance of embedded analytics in technologies and initiatives strategic to business intelligence.
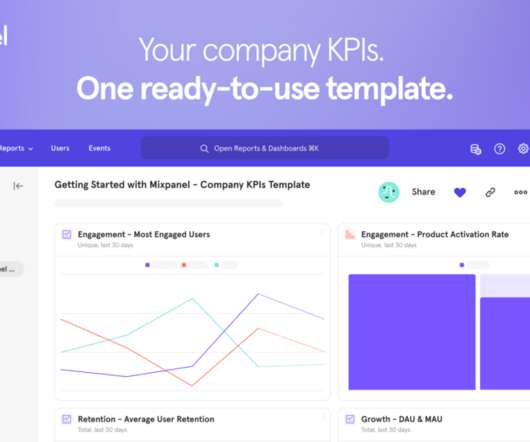
Product analytics can help by showing companies what is and isn’t working with their websites and apps, what to prioritize, and what to invest in. Product analytics can help by showing companies what is and isn’t working with their websites and apps, what to prioritize, and what to invest in. Company KPIs Dashboard Template.
The following data on mobile surveys and interaction and response rates is from our 2022 Mobile App Customer Engagement Report. At year end, interaction rates remained equal to what they were in 2020 at 26%. There was a 9% increase in the number of surveys sent in 2021 from 2020. Mobile survey benchmarks.
And that’s where our 2020 Mobile App Customer Engagement Benchmark Report comes in! We gathered mobile customer engagement data from more than 800 apps with 5,000 active users or more, analyzed it all, and packaged it up into a cohesive report for you. Mobile app customer retention data.
The following data and information on Utilities apps is from our 2022 Mobile App Customer Engagement Report. Data included: Ratings and reviews. DOWNLOAD THE FULL 2022 BENCHMARK REPORT HERE. While annual retention is still below the overall average, it’s a 100% increase from their 2020 annual retention of 19%.
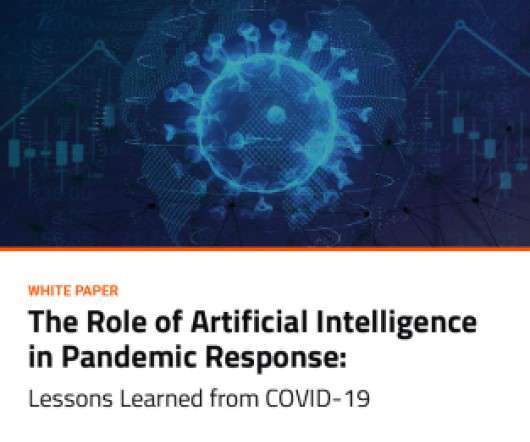
In March 2020, the world was hit with an unprecedented crisis when the COVID-19 pandemic struck. As the disease tragically took more and more lives, policymakers were confronted with widely divergent predictions of how many more lives might be lost and the best ways to protect people. health reporting standards.
Watch our latest webinar where Robi Ganguly, Apptentive CEO and Co-founder, and Christy Culp, Apptentive VP of Customer Success, share exclusive data and key insights from our 2020 Mobile App Engagement Benchmark Report. We discuss mobile engagement data specifically in the following categories: Sentiment analysis.
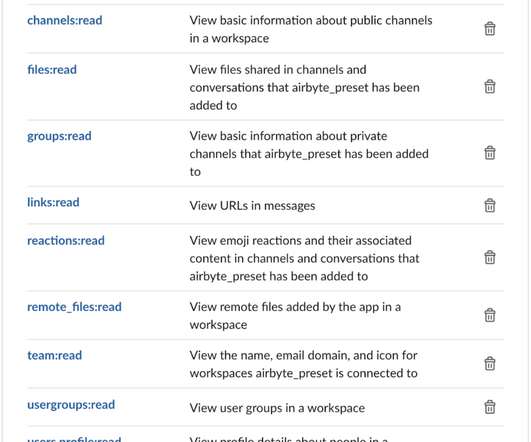
an open-source data integration platform?—?and an open-source data exploration platform?—?in We will use the Airbyte’s Slack connector to get the data off a Slack workspace (we will be using Airbyte’s own Slack workspace for this tutorial). We will save the data onto a PostgreSQL database. and Apache Superset ?—?an
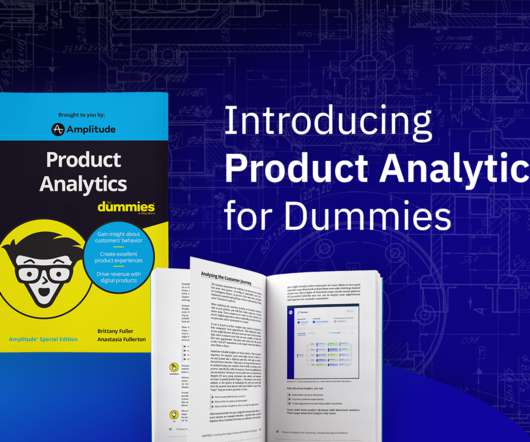
Product analytics sits at the intersection between your customer, your product, and your business goals. Product analytics keeps your team close to customer wants and needs throughout the product development process. Adience’s research highlights the power of product analytics. What Is Product Analytics?
Query notes can be viewed in the query itself, or when your query is saved as a bookmark or to a dashboard. To use query notes, select the pencil icon to the right of the query builder or on a dashboard, open Widget Settings, then select Edit Query Notes. Data Sources / Connect Your Data. Data Dictionary Updates.
Speaker: M.K. Palmore, VP Field CSO (Americas), Palo Alto Networks
He will use a combination of industry insights through statistical observations and direct customer feedback to emphasize the importance of adopting new technologies to battle an ever changing threat landscape. In this webinar, you will learn: The future of data security. How to update existing tech stacks to optimize data security.
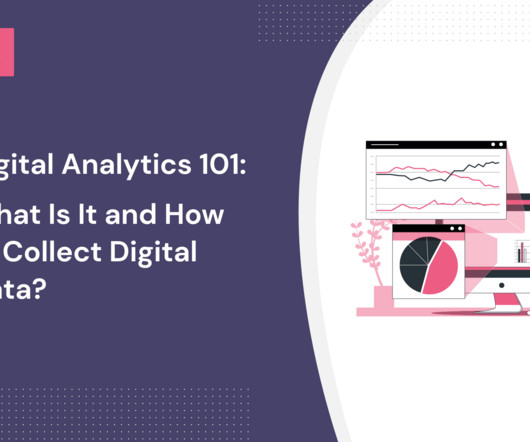
What’s digital analytics? How can it help product and marketing teams make data-driven decisions and improve the user experience at different stages of the customer journey? TL;DR Digital analytics allows teams to measure and analyze product performance to improve their digital strategy. This could be website data (e.g.,
Landing pages can be set up with no cost or hassle with a tool like Squarespace or Wix. Once your landing page is live, you can start collecting leads, offer a preview of your app press and early adopters, and integrate with an analytics or A/B testing tool to test variations of your messaging strategy. PLAN A BETA RELEASE.
2020 has been volatile for Finance apps. And in order to get there, we need to look at data from before the world changed while we try to interpret what comes next. Apptentive published our 2020 Mobile App Engagement Benchmark Report for Finance apps in early March, right as COVID-19 hit North America hard.
2020 was a year of growth and transformation for Indicative. We launched new features, visualizations, and types of analysis, such as Stacked Bar Funnels and Segmentation Frequency. If you would like assistance in reviewing your data model or event schema, or if you have any questions or concerns, please contact support@indicative.com.
Speaker: Miles Robinson, Technical Project Manager, iFixIt
How to frame the data to help make that decision can be done by instinct, or it can be done SMART: Specific definition of the project scope and completion. Each of the tools can be used in isolation or together, and they all help to bring clarity and structure to the data you will need to make the best use of your time, money and people.
Download the 2020 Mobile Customer Engagement Benchmark Report for Travel Apps. We gathered mobile customer engagement data from more than 800 apps with 5,000 active users or more, analyzed it all, and packaged it up into a cohesive report for you. Mobile app customer retention data. Customer sentiment distribution.
While this shift was already underway, the rate of digital transformation is now happening much faster than previously predicted due to the impact of the COVID-19 pandemic. According to the International Data Corporation (IDC) , 65% of global GDP will be digitalized by 2022, and investment in digital transformation (DX) continues to grow.
The following data and information on Travel apps is from our 2022 Mobile App Customer Engagement Report. The Auto subcategory experiences less volatility in 2020, and saw 2021 benchmarks in-line with the year prior as a result. Data included: Ratings and reviews. DOWNLOAD THE FULL 2022 BENCHMARK REPORT HERE.
We’re also adopting new shopping strategies such as using delivery services and curbside pickup. Download the 2020 Mobile Customer Engagement Benchmark Report for Retail Apps. Data included in the report: The profile of an average app in the Retail/Shopping category. Mobile app customer retention data.
Speaker: Mark Ridley, Owner and Founder, Ridley Industries
In most cases, actually building software should be the last avenue that companies explore to deliver great products, as software engineering, data science and product development are complex, uncertain and hard to manage. What happens to the business if the product provider switches off the service that was bought?
The food and drink industry was heavily impacted by restrictions on dining, shopping, and delivery in 2020. In our 2021 Mobile App Engagement Benchmark Report , a study of 1,000 apps across a billion+ app installs, we take a close look at apps in the Food and Drink category. 2021 Engagement Benchmarks for Food and Drink Apps.
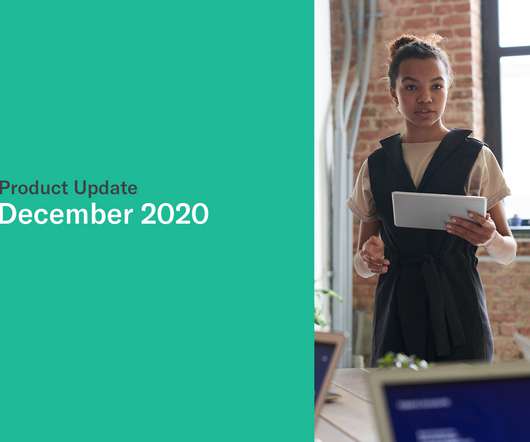
Despite the wild ride that 2020 was for all of us, our team here at Apptentive continued to produce high-quality content for product managers, mobile marketers, and C-suite executives interested in digital transformation. However, I’ll let our data speak for itself. However, I’ll let our data speak for itself. Food & Drink.
Software-as-a-service (SaaS) models, which operate on a subscription basis and are centralized and situated on a remote cloud network, are increasingly popular with businesses for a variety of factors, including flexibility and affordability. Saas startups that provide software as a service have a good delivery model. What Is Saas? — Brief
The following data and information on Shopping apps is from our 2022 Mobile App Customer Engagement Report. Pandemic-driven lockdowns drove hoards of new consumers into mobile Shopping apps in 2020, and in 2021, many stayed in mobile experiences rather than going back to in-person shopping. Data included: Ratings and reviews.
Join Janelle Estes, Chief Insights Officer, at UserTesting, for a comprehensive episode on getting the data you need to relearn you customers and succeed. Wednesday December 9th, 2020 at 9:30AM PDT, 12:30PM EST, 4:30PM GMT. Integrating their feedback is the first step! Real-life examples of this process.
We organize all of the trending information in your field so you don't have to. Join 96,000+ users and stay up to date on the latest articles your peers are reading.
You know about us, now we want to get to know you!
Let's personalize your content
Let's get even more personalized
We recognize your account from another site in our network, please click 'Send Email' below to continue with verifying your account and setting a password.


Let's personalize your content